 Coinwaft
Bitcoin Pushes Back Above $71K as JPMorgan Signals Long-Term Strength Over Gold
JPMorgan projects $266K long-term target as crypto market rebounds $304 billion from weekly lows
13 hours ago
Last updated
13 hours ago

KEY FACTS
- Bitcoin reclaimed $71,000 with a 6.56% daily gain after falling below $65,000 during last week's selloff.
- JPMorgan strategists argue Bitcoin looks more attractive than gold long-term, projecting a potential $266,000 target.
- Spot Bitcoin ETFs saw $1.19 billion in weekly outflows despite the price recovery, creating uncertainty about institutional support.
Bitcoin surged past $71,000 on February 6 after a brutal week-long selloff that wiped out over $250 billion in market capitalization. The flagship cryptocurrency climbed 6.56% in 24 hours, trading at $71,076.11. This recovery added approximately $10,000 from recent lows near $65,000.
The broader crypto market followed suit, with over $304 billion returning to total market capitalization within 20 hours. Ethereum posted an 18% gain, reclaiming $2,000 from lows of $1,750. Meanwhile, short positions worth $550 million were liquidated during the rapid price recovery.
Bitcoin’s market cap now stands at $1.42 trillion. Despite the bounce, the asset remains down 14.45% over the past seven days. The selloff had briefly pushed prices below the 2021 all-time high, triggering widespread concern among investors.
JPMorgan Projects Bitcoin’s Long-Term Edge Over Gold
JPMorgan strategists released a note arguing Bitcoin looks more attractive than gold on a long-term, risk-adjusted basis. The bank cited Bitcoin’s volatility ratio hitting a record low of 1.5, even as gold surged 60% in 2025.
The strategists noted Bitcoin currently trades well below its estimated production cost of $87,000. Historically, this level has served as a soft floor for the asset. JPMorgan projects a potential long-term target of $266,000 for Bitcoin to match private gold investments.
The bank views Bitcoin as a maturing store of value and a rival to gold. This assessment comes despite ongoing criticism from CEO Jamie Dimon. Short-term pressures, including ETF outflows, continue to weigh on prices.
Gold and silver also recovered during this period. Gold climbed 5.8% from its daily low, adding roughly $1.87 trillion to its market cap. Silver rallied 18%, regaining about $672 billion in market value. Markets reacted to easing geopolitical tensions amid rumors of fresh U.S.-Iran talks.
Bitcoin ETF Outflows Persist Despite Price Recovery
Bitcoin ETFs recorded significant outflows despite the price rebound. According to Lookonchain data, spot Bitcoin ETFs saw net outflows of 6,201 BTC, worth $422.85 million, in one day. Weekly outflows totaled 17,435 BTC, approximately $1.19 billion.
The disconnect between ETF flows and price action raises questions about institutional sentiment. Analysts note that upcoming ETF flow data will serve as a critical gauge of whether institutional buying supports this bounce.
The selloff triggered $964.69 million in 24-hour liquidations. Long positions accounted for 72% of that total. This massive flush of leveraged positions likely removed immediate selling pressure, allowing prices to recover.
BTC Chart Signals Oversold Conditions Amid Bearish Trend
Bitcoin’s daily chart reveals a decisively bearish primary trend with consistent lower highs and lower lows since August 2025. The recent price action tested support at $68,000-$70,000, where the current bounce originated.
The 14-day RSI sits at 32.36, near oversold territory. The indicator recently bounced from extreme readings around 25-28. No bullish divergence has formed yet, as both price and RSI continue making lower lows.
MACD readings remain deeply negative, with the histogram showing expanding red bars. The MACD line stands at -2,056.05 against a signal line of -3,416.21. No bullish crossover appears imminent based on current readings.
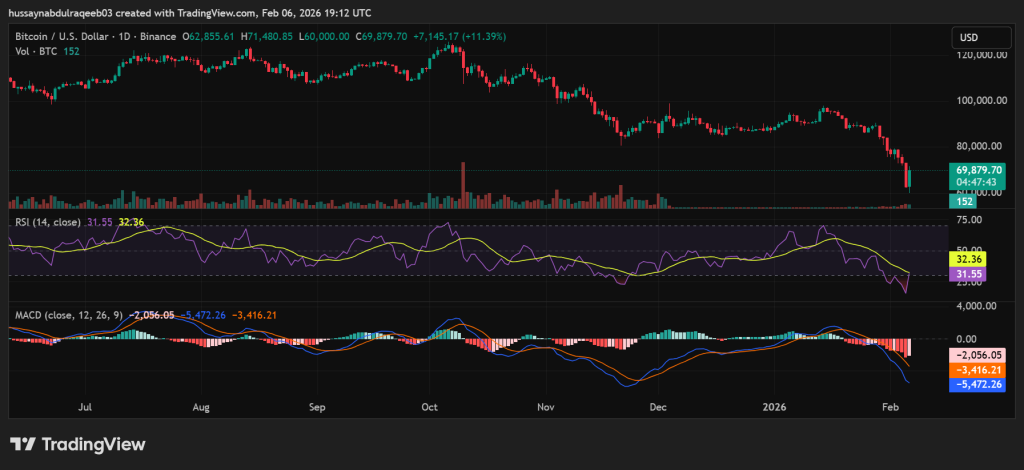
Key Fibonacci levels place immediate resistance at $74,000-$78,000 (0.236 retracement). Major resistance sits at $85,000-$88,000, the critical breakdown level. Support holds at $68,000-$70,000, with secondary support at $60,000.
Volume analysis shows elevated selling during the decline with moderate buying on the current bounce. This pattern suggests relief rally characteristics rather than accumulation.
The near-term trajectory hinges on Bitcoin defending $70,000 support. A sustained hold could fuel a move toward $75,900-$78,000 resistance. Failure to maintain support reopens downside risk toward $63,800. The outlook remains cautiously bullish but fragile, pending confirmation from ETF flows and technical level defense.
Disclaimer: Coinwaft is a crypto media platform providing cryptocurrency news, analysis, and trading information. The content of this article is for informational purposes only and should not be considered as financial, legal, or investment advice. Readers are advised once again to research or consult a financial expert before making any financial decision.
© 2026 Coinwaft. All Rights Reserved.

Abdul-Raqeeb Hussayn
Abdul-Raqeeb Hussayn
I'm a Web3 content writer with a Web2 marketing background. I create blogs, reports, and market analysis that make complex blockchain concepts clear for readers and credible for investors.
Author profileTrending Today

zkPass
ZKP
$0.12

Pudgy Penguins
PENGU
$0.01

Canton
CC
$0.17

Bitcoin
BTC
$70,380.25

Solana
SOL
$87.26

BankrCoin
BNKR
$0

Hyperliquid
HYPE
$31.54

Bittensor
TAO
$162.27
newsletter
Busy Wealth
Join the Busy Wealth newsletter that helps thousands of investors get early alpha and understand the crypto market.
By pressing the "Subscribe button" you agree with our Privacy Policy.
Crypto Today