 Coinwaft
Bitcoin Reclaims $79K After 10% Flash Dump —Bearish Retest or Recovery?
Weekend selloff erases $265 billion as ETF outflows surge and technical indicators flash warning signals across the crypto market
1 day ago
Last updated
1 day ago

KEY FACTS
- Bitcoin crashed below $78K over the weekend, erasing $265 billion in market cap with weekly losses exceeding 11%.
- ETF outflows hit $1.49 billion for Bitcoin while Ethereum and Solana each dropped over 13% in 24 hours.
- Technical indicators show deeply oversold conditions with RSI at 26.98, but market structure favors continued bearish momentum.
Bitcoin has now reclaimed $79,000 after plunging below $78,000 over the weekend, erasing over $265 billion in market capitalization as volatility surged across the cryptocurrency market. The flagship cryptocurrency dropped more than 7% in a matter of days, falling to a low of $74,600. The coin now sells for a low of $79,002.37 at press time.
The weekly decline reached 11.34%, pushing Bitcoin out of the top 10 largest assets by market capitalization. The coin’s total market cap now stands at approximately $1.57 trillion. Meanwhile, Ethereum and Solana each suffered over 13% declines within 24 hours.
ETH lost over $91 billion in market cap, while SOL shed more than $16 billion. XRP remained the sole outlier among major cryptocurrencies, recording positive ETF net inflows of $52.26 million.
Bitcoin-focused ETFs experienced net outflows exceeding $1.49 billion, according to Coinwaft. Ethereum ETFs saw outflows of $326.93 million, while Solana products recorded $2.45 million in redemptions.
Bitcoin UTXO Data and Volatility Metrics Signal Bearish Regime
Data from Binance reveals Bitcoin’s volume-weighted average price reached approximately $79,870. Daily trading volume hit 39,500 BTC, a relatively high figure compared with recent periods of stability.
The increased volume occurred without corresponding price movement, pointing to an ongoing battle between buyers and sellers. The range percentage stood at approximately 0.106%, confirming constrained price action.
However, standardized volatility metrics surged to historically elevated levels. The vol z30 index reached +2.69, while range z30 climbed to +3.72. Readings above +3 on range z30 have historically preceded strong directional moves.
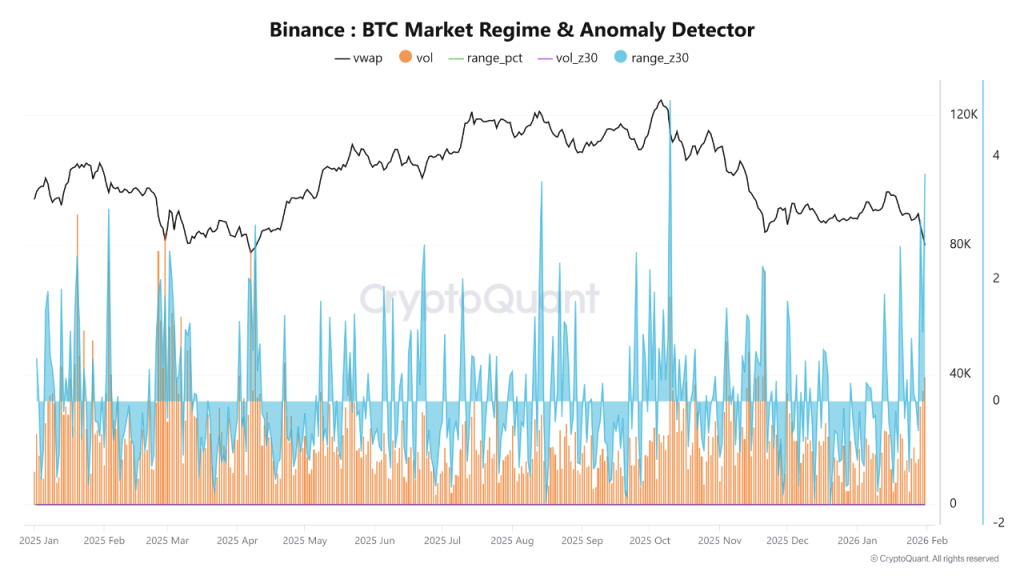
CryptoQuant analysis of the 12-18 month UTXO age band shows Bitcoin trading below this cohort’s realized price. This places medium-term holders into negative unrealized profit and loss territory.
When price sustains below this cost basis, market behavior has historically transitioned into structural bearish regimes. The cohort maintains a large supply share, though the 30-day balance change shows slowing accumulation rates.
BlackRock, Strategy, and Binance Make Major BTC Moves Amid Selloff
According to Lookonchain, BlackRock deposited 6,918 BTC worth $538.6 million and 58,327 ETH valued at $133.6 million to Coinbase Prime within the past hour. The deposits coincide with broader market turbulence.
Conversely, Michael Saylor’s Strategy continued its accumulation strategy, purchasing 855 BTC for $75.22 million at an average price of $87,974 last week. The company now holds 713,502 BTC worth $55.51 billion.
Strategy’s average buying price stands at $76,052, leaving the firm with unrealized profits of $1.25 billion, representing a 2.3% gain. Binance’s SAFU Fund also entered the market, acquiring 1,315 BTC worth $100.7 million.
BTC Daily Chart Shows Oversold Conditions Amid 35% Drawdown
Bitcoin’s daily chart displays a sustained downtrend from July-August 2025 highs near $120,000 to the current $79,000 level. This represents approximately a 35% drawdown from peak to trough.
The price currently touches the lower Bollinger Band at $78,012.48, with the middle band at $88,551.06 serving as dynamic resistance. Bollinger Bands have widened significantly, confirming elevated volatility during the selloff.
The Relative Strength Index reads 26.98, placing Bitcoin in deeply oversold territory below the 30 threshold. No bullish divergence appears on the indicator. Massive volume accompanied the breakdown below $80,000, validating the move as genuine distribution.
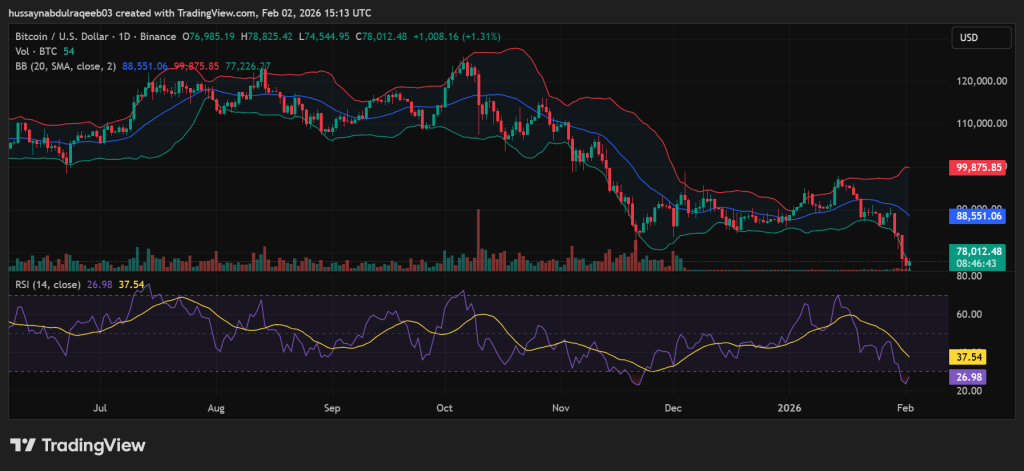
Critical support sits at the $78,000-$77,226 zone, with secondary support at $74,500-$75,000. Resistance levels include $80,000-$82,000 immediately above, with the crucial $88,500-$90,000 zone representing the 20-period SMA.
A daily close below $77,500 would likely trigger continuation toward $74,500-$75,000, with potential extension to $70,000-$72,000. A hold above $78,000 with volume expansion could produce a relief bounce toward $82,000-$85,000.
Based on current market structure, price trajectory remains bearish with a 60-65% probability of continued downside. Reclaiming $88,000-$90,000 with sustained volume would invalidate the bearish setup.
Disclaimer: Coinwaft is a crypto media platform providing cryptocurrency news, analysis, and trading information. The content of this article is for informational purposes only and should not be considered as financial, legal, or investment advice. Readers are advised once again to research or consult a financial expert before making any financial decision.
© 2026 Coinwaft. All Rights Reserved.

Abdul-Raqeeb Hussayn
Abdul-Raqeeb Hussayn
I'm a Web3 content writer with a Web2 marketing background. I create blogs, reports, and market analysis that make complex blockchain concepts clear for readers and credible for investors.
Author profileTrending Today

Bitcoin
BTC
$75,996.19

TRIA
TRIA
$0.02

Hyperliquid
HYPE
$33.37

Zama
ZAMA
$0.03

Solana
SOL
$98.44

Ondo
ONDO
$0.28

Pudgy Penguins
PENGU
$0.01

Sui
SUI
$1.12
newsletter
Busy Wealth
Join the Busy Wealth newsletter that helps thousands of investors get early alpha and understand the crypto market.
By pressing the "Subscribe button" you agree with our Privacy Policy.
Crypto Today