 Coinwaft
Bitcoin Slips Below 2021 All-Time High as Downtrend Deepens — Is $58K the Next Target?
ETF outflows reach $1.28 billion weekly as over $641 million in leveraged longs get liquidated, pushing Bitcoin into extreme oversold territory
10 hours ago
Last updated
10 hours ago

KEY FACTS
- Bitcoin dropped below $68K and its 2021 all-time high, falling 21.8% weekly to $65,550 with $100B+ in market cap erased
- Spot Bitcoin ETFs saw $1.28B in weekly outflows while $641M in leveraged long positions were liquidated in 24 hours
- RSI at extreme oversold 17.10 but no reversal signals yet — analysts target $58K-$60K as next major support zone
Bitcoin has fallen below its 2021 all-time high, dropping beneath the $68,000 level as bearish momentum accelerates across the cryptocurrency market. The flagship digital asset now trades at $65,550.81, marking a 9.85% decline over the past 24 hours and a 21.8% loss over the past week.
The sharp downturn has pushed Bitcoin’s market capitalization down to $1.34 trillion. More than $100 billion in value has been erased in the last 24 hours alone. Analysts are now eyeing the $58,000 level as the next potential support zone.
According to Lookonchain, spot Bitcoin ETFs recorded significant outflows during this period. On the daily timeframe, net outflows reached 7,925 BTC, equivalent to $533.16 million. Over the seven-day period, outflows totaled 19,090 BTC, amounting to $1.28 billion in capital leaving these investment vehicles.
BTC Liquidations Surge as Leveraged Longs Unwind
The decline accelerated as over-leveraged long positions faced forced liquidations. Bitcoin liquidations reached $641.51 million within 24 hours, representing an 86% increase. Long positions dominated these liquidations.
Open interest had risen 5.33% prior to the move, pointing to crowded positioning in the derivatives market. This buildup unwound rapidly as prices fell, amplifying the downward pressure through internal market mechanics rather than purely external selling.
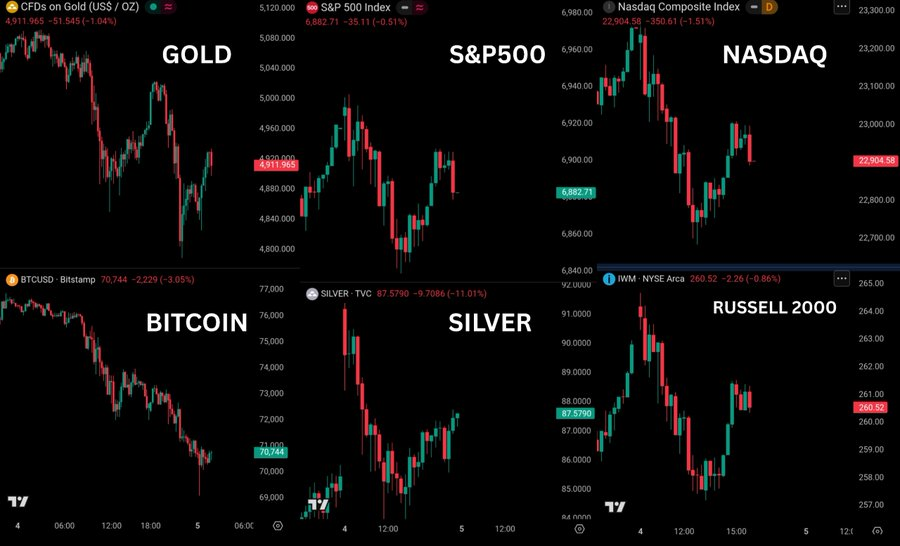
The cryptocurrency’s correlation with traditional assets remained elevated during the sell-off. Bitcoin showed a 0.79 correlation with the S&P 500 and a 0.72 correlation with Gold over 24 hours.
Meanwhile, traditional markets also suffered losses. Gold dropped 5.5%, erasing $1.94 trillion in market value. Silver fell 19%, wiping out $980 billion. The S&P 500 declined 0.95%, losing $580 billion, while the Nasdaq dropped 2.5%, shedding $1 trillion.
The total cryptocurrency market fell 7%, eliminating $184 billion in combined value across digital assets.
BTC Analysts Split on Relief Rally Outlook
According to analyst Rekt Capital, Bitcoin has rebounded roughly 20% from the base of its macro descending triangle. He noted that if this pattern resembles a relief rally within an early-stage bear market, much of the upside may already be exhausted.
Price has been rejected just below the macro downtrend line. Rekt Capital stated that a decisive break above this downtrend would be required to confirm a renewed bullish bias.
He warned that weaker rebounds from the descending triangle’s base could eventually lead to support failure. Such a development would confirm a broader bear market structure.
In contrast, analyst Ted Pillows highlighted approximately $273.5 million worth of Bitcoin buy orders placed on Binance between $60,000 and $68,000. He described this concentration of bids as a high-demand zone that could provide support.
BTC Chart Shows Extreme Oversold RSI and Key Support Levels
Bitcoin’s daily chart confirms a clear macro downtrend since the approximately $120,000 peak. The price structure shows a textbook series of lower highs and lower lows with impulsive bearish momentum.
The Relative Strength Index (RSI) has dropped to 17.10, placing the asset in extreme oversold territory. However, no bullish divergence has formed, as both price and RSI continue making lower lows.
The MACD indicator shows the main line at -2,091.36 with the signal line at -2,859.44. The expanding negative histogram confirms accelerating bearish momentum with no reversal signals present.
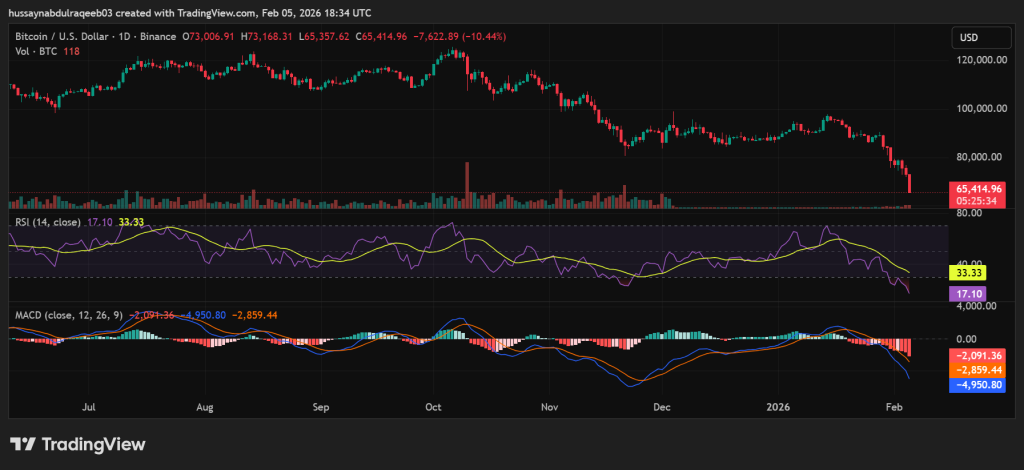
Immediate support sits at the $65,000-$64,500 zone, currently under aggressive testing with minimal bounce conviction. The major demand zone lies between $60,000 and $58,000, where historical accumulation and institutional bids may provide stronger defense.
Key resistance levels include the $70,000-$72,000 range, which represents flipped support turned resistance. The Fibonacci 0.236 retracement at $78,000 marks a minor retracement target. Stronger resistance clusters at $80,000-$82,000 and the Fibonacci 0.382 level at $86,000.
A breakdown below $65,000 support opens a path toward the $60,000-$58,000 demand zone. The technical outlook remains bearish until Bitcoin reclaims the $70,000 level, which would signal short-term selling pressure is easing.
Disclaimer: Coinwaft is a crypto media platform providing cryptocurrency news, analysis, and trading information. The content of this article is for informational purposes only and should not be considered as financial, legal, or investment advice. Readers are advised once again to research or consult a financial expert before making any financial decision.
© 2026 Coinwaft. All Rights Reserved.

Abdul-Raqeeb Hussayn
Abdul-Raqeeb Hussayn
I'm a Web3 content writer with a Web2 marketing background. I create blogs, reports, and market analysis that make complex blockchain concepts clear for readers and credible for investors.
Author profileTrending Today

Bitcoin
BTC
$70,680.17

Pudgy Penguins
PENGU
$0.01

XRP
XRP
$1.47

Solana
SOL
$88.66

Ethereum
ETH
$2,060.74

Berachain
BERA
$0.54

Hyperliquid
HYPE
$32.92

Sui
SUI
$1.01
newsletter
Busy Wealth
Join the Busy Wealth newsletter that helps thousands of investors get early alpha and understand the crypto market.
By pressing the "Subscribe button" you agree with our Privacy Policy.
Crypto Today