 Coinwaft
Binance Stablecoin Inflows Reach $7.3B High — Bitcoin Rally to $125K Next?
4 Mins
November 3, 2025 at 10:38 PM
Last updated
November 3, 2025 at 10:38 PM

Binance has recorded $7.3 billion in stablecoin inflows over the past 30 days, reaching levels not seen since December 2024. CryptoQuant data shows fresh capital entering the market at a pace historically associated with major Bitcoin rally.
The last time Binance experienced comparable inflow levels, Bitcoin rally from $67,000 to $108,000 within weeks. Market observers now monitor whether this liquidity injection will fuel the next significant price movement.
Market Sentiment Remains Cautious Despite Capital Influx
Bitcoin currently trades at $107,465, down 2.51% in the past 24 hours. The cryptocurrency’s market capitalization dropped to $2.141 trillion from $2.25 trillion just days earlier.
The Crypto Fear & Greed Index registers 42, indicating neutral sentiment. Neither fear nor greed dominates investor psychology, suggesting the market is digesting recent volatility and seeking direction.
Federal Reserve Chairman Powell’s recent rate cut and dovish stance prioritize liquidity stability over inflation tightening. Traders await confirmation of broader market recovery before committing to aggressive positions.
Meanwhile, technical indicators reveal a critical juncture. Price action consolidates between key support at 85 and resistance around 94, while momentum indicators show bearish divergence with consecutive lower highs.
Analysts Project $125K Bitcoin Rally Despite Current Pressure
Michaël van de Poppe, CIO and Founder of MN Fund and MN Capital, emphasized Bitcoin’s weekly chart remains healthy. He stated periods of consolidation and correction are normal.
Van de Poppe added that a green week ahead would signal progression toward new all-time highs. The current chart structure does not indicate Bitcoin has peaked, according to his assessment.
Rekt Capital, a crypto analyst, noted Bitcoin Dominance closed below 60.20% on monthly timeframes. This level continues solidifying as resistance, keeping dominance within the 57.68%-60.20% range.
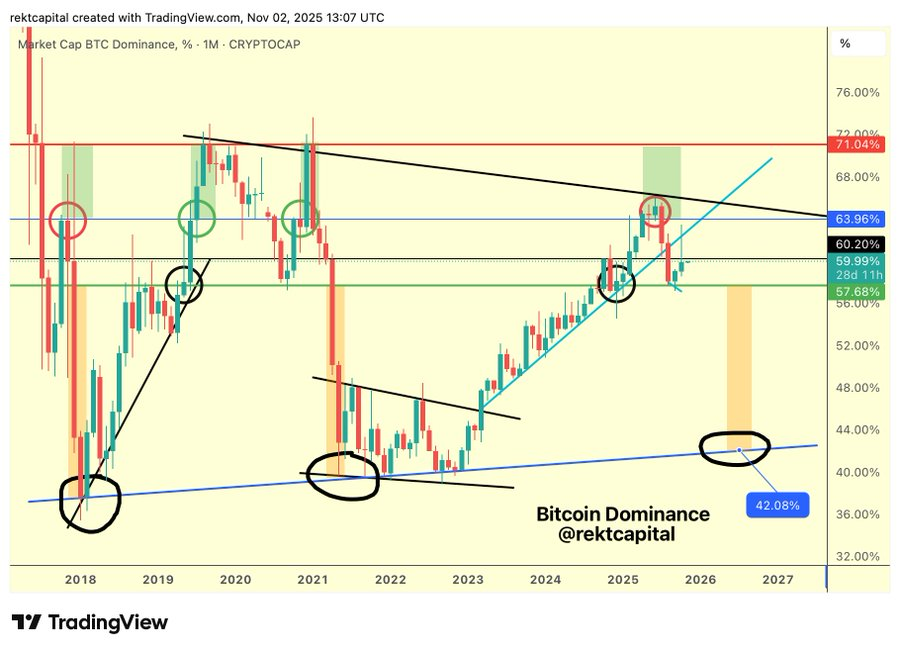
Unless Bitcoin Dominance reclaims 60.20% as support short-term, additional consolidation downward within the range remains likely. This dynamic affects altcoin performance relative to Bitcoin.
Twenty One Capital CEO Jack Mallers told Bloomberg TV that Bitcoin’s price trajectory points higher. He cited the cryptocurrency’s scarcity and substantial buying demand as primary drivers.
Mallers emphasized his firm measures value in Bitcoin rather than fiat currencies. This approach mirrors MicroStrategy’s treasury strategy, positioning Bitcoin as both store of value and unit of account.
“We plan to build Bitcoin products, asides acquiring as much Bitcoin as possible raising capital, we also want to build products, technology and tools that can position Twenty One as a competitor to both Coinbase and MicroStrategy.” He said.
A market analyst on X listed multiple bullish catalysts: Federal Reserve rate cuts in December, quantitative tightening ending December 1, and quantitative easing resuming.
Additional factors include the crypto market bill nearing passage, a U.S.-China trade deal signing, gold topping out, and U.S. stocks hitting new highs.
Technical Analysis: Bitcoin Consolidates Between $106K-$115K as Momentum Weakens.
The current chart displays Bitcoin at a decision point. Price consolidates between strong support at $105k and resistance near $115k, forming a range that has held for an extended period.
Multiple horizontal resistance zones cluster around $114k- $118k, marked by repeated tests without breakthrough. The $106k support level, highlighted in golden yellow, has consistently prevented deeper declines.
A series of higher highs from 2023 through 2025 established the bullish structure. Price advanced from approximately $40k to $126k before entering the current consolidation phase.
The momentum indicator reveals a classic bearish divergence. While price maintains elevated levels, the oscillator prints consecutive lower highs connected by a descending trendline.
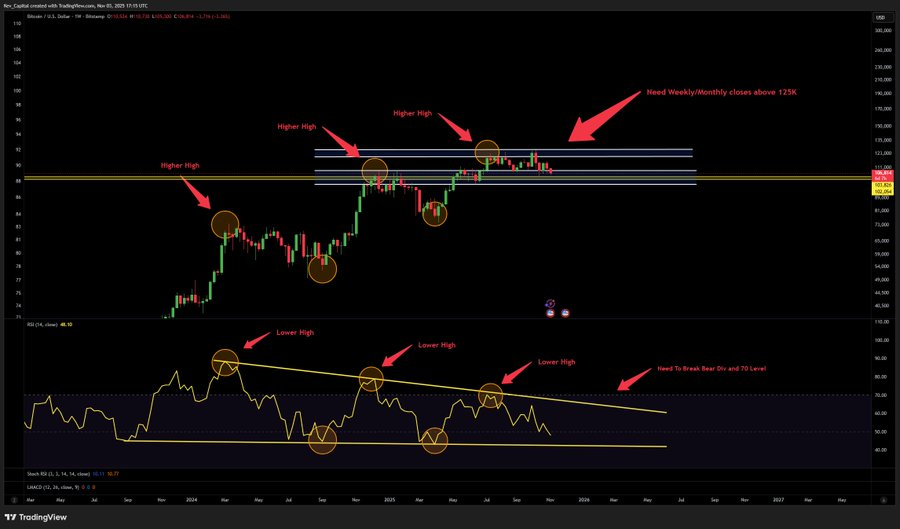
This divergence suggests weakening buying pressure despite price stability. The annotation indicates weekly or monthly closes above 12.5% higher would break this bearish pattern.
Such a move would require clearing the $115,000 resistance zone decisively. Conversely, a weekly close below $104,000 would confirm bearish breakdown with targets toward $94,500- $100,000
The coiling pattern suggests significant volatility approaches. Breakout direction depends on which level fails first: resistance at $113,000 triggering bullish continuation or support at $106,000 enabling correction.
Current market structure favors range-bound trading until clear directional confirmation emerges. The path to $125K requires sustained closes above 94 with accompanying volume and momentum confirmation.
Disclaimer: Coinwaft is a crypto media platform providing cryptocurrency news, analysis, and trading information. The content of this article is for informational purposes only and should not be considered as financial, legal, or investment advice. Readers are advised once again to research or consult a financial expert before making any financial decision.
© 2026 Coinwaft. All Rights Reserved.

Abdul-Raqeeb Hussayn
Abdul-Raqeeb Hussayn
I'm a Web3 content writer with a Web2 marketing background. I create blogs, reports, and market analysis that make complex blockchain concepts clear for readers and credible for investors.
Author profileTrending Today

Bitcoin
BTC
$76,630.73

TRIA
TRIA
$0.02

Hyperliquid
HYPE
$33.45

Solana
SOL
$99.08

River
RIVER
$13.47

Pudgy Penguins
PENGU
$0.01

Zama
ZAMA
$0.03

Bittensor
TAO
$197.32
newsletter
Busy Wealth
Join the Busy Wealth newsletter that helps thousands of investors get early alpha and understand the crypto market.
By pressing the "Subscribe button" you agree with our Privacy Policy.
Crypto Today