 Coinwaft
Bitcoin Breaks Higher towards $85k as Gold and Silver See Heavy Sell-Off
Precious metals suffer worst crash in decades as over $7 trillion evaporates; analysts question Bitcoin's recovery path
3 days ago
Last updated
3 days ago

KEY FACTS
- Bitcoin gains 3% near $84k while gold and silver crash, erasing $7 trillion in 36 hours
- Silver enters historic danger zone after 30% drop, with RSI levels seen only twice in 60 years
- Technical analysis shows BTC testing $83,500 support with bearish momentum intact
Bitcoin has gained nearly 3% in the last hour while precious metals face their largest crash in decades. Gold dropped 13.6% below $4,900, erasing $5 trillion in value. Silver collapsed 30% below $85, wiping out $1.96 trillion in just 36 hours.
As at time of writing, the cryptocurrency trades at $83,937.40, marking a 0.1% increase over 24 hours. However, BTC recorded a 6.01% weekly decline amid broader market turbulence. Analysts now question whether Bitcoin can recover from current levels.
According to Lookonchain, Bitcoin ETFs experienced significant outflows during this period. One-day net flows showed withdrawals of 7,856 BTC worth $653.98 million. Weekly outflows reached 10,695 BTC, totaling $890.28 million in redemptions.
Precious Metals Enter Historic Danger Zone
Silver’s monthly RSI reached 95 before the crash, the second-highest reading in over 60 years. This extreme level has appeared only twice in modern history.
During 1979-1980, silver’s monthly RSI moved above 90. The metal subsequently collapsed 90% from its peak. In 2009-2011, similar RSI extremes preceded a 65% decline from peak to trough.
Silver peaked at $122 before falling to $83, representing a 30-32% decline so far. Historical patterns suggest the first sharp drop typically does not mark the bottom. Price resets aggressively before stabilizing when silver becomes this overextended.
Platinum dropped 27.25% below $2,100, erasing $215 billion in value. Palladium fell 21.5% below $1,700, wiping out $85 billion. Over $7 trillion has been erased from precious metals markets combined.
Bitcoin Outperforms Amid Broader Selloff
According to CryptoQuant, Bitcoin experienced a more moderate pullback of about 5% compared to gold and silver. The S&P 500 and Nasdaq were not spared from the broader market selloff.
Microsoft announcements related to artificial intelligence investments triggered the decline. The company’s stock dropped more than 12%, causing a domino effect across global markets.
The correction triggered nearly $300 million in long position liquidations within hours. Hyperliquid accounted for the largest share at $87.1 million. Binance recorded roughly three times less at around $30 million despite higher trading volumes.
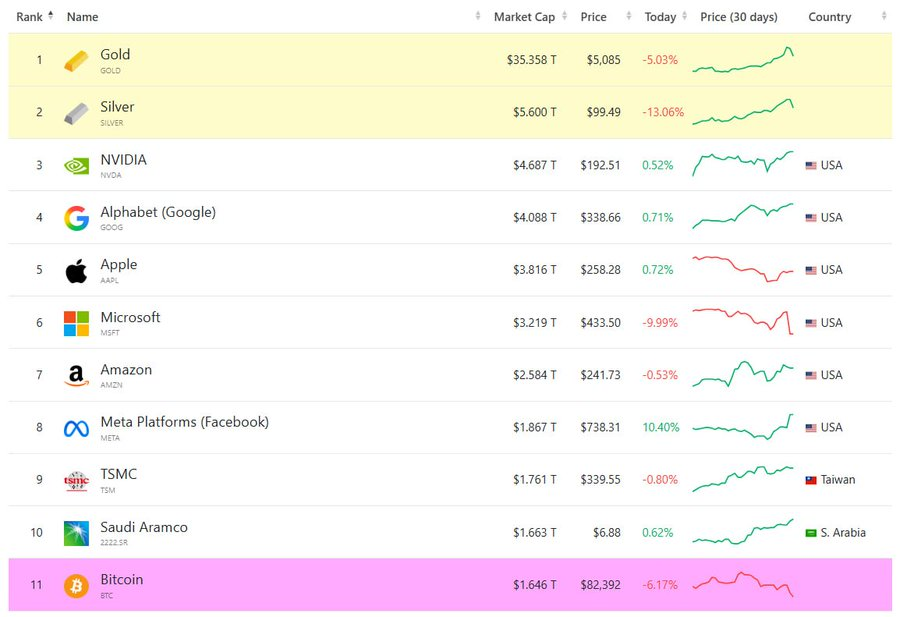
Bitcoin has fallen out of the top 10 global assets by market cap, now ranked 11th. The cryptocurrency holds a $1.66 trillion market cap, trailing gold, silver, Nvidia, Alphabet, and Aramco.
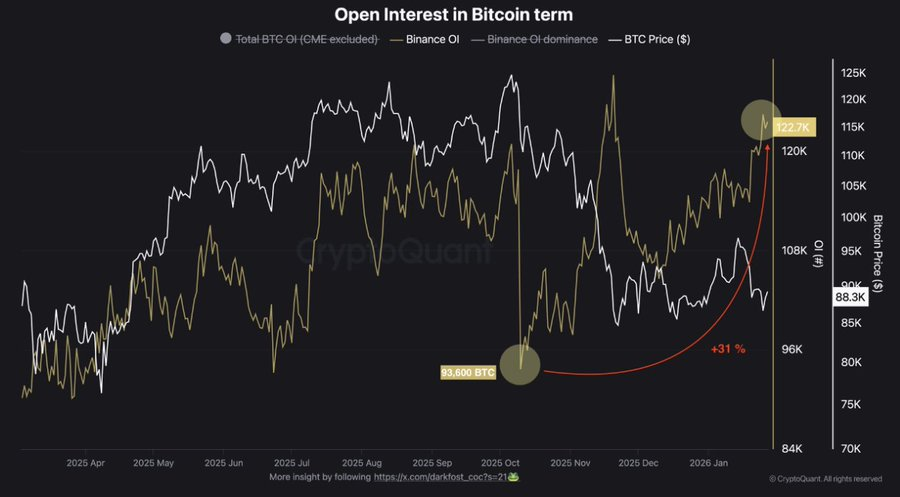
Open interest on Binance reached 123,500 BTC, surpassing pre-October 10 levels of 93,600 BTC. This represents a 31% increase, reflecting returning risk appetite among investors.
Bloomberg Senior ETF Analyst Eric Balchunas noted Bitcoin has risen 429% since 2022, compared to gold’s 177% and silver’s 350%. The QQQ index gained 140% over the same period. Balchunas suggested the institutionalization narrative was priced in quickly ahead of actual adoption.
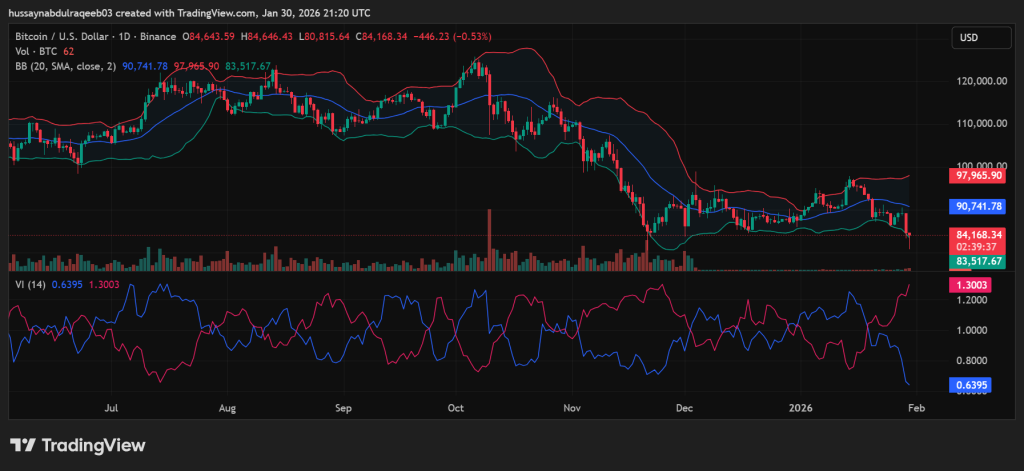
BTC Tests Lower Bollinger Band as Bearish Indicators Dominate
Bitcoin trades at $84,168.34 on the daily chart, down 0.53% over 24 hours. The price has declined approximately 30% from cycle highs near $120,000.
The Bollinger Bands show elevated volatility. The upper band sits at $97,965.90 while the lower band rests at $83,517.67. Price is hugging the lower band, just $650 above it.
The 20-day SMA at $90,741.78 serves as dynamic resistance. Multiple bounce attempts have failed at this level. Reclaiming this zone would be necessary for any trend shift consideration.
Immediate support exists at $83,500-$84,000, currently being tested. Secondary support sits at $80,800-$81,000 from multiple prior tests. Major support lies at $76,000-$78,000.
The Vortex Indicator shows extreme bearish dominance. VI- reads 1.3003 while VI+ shows 0.6395. This 2:1 ratio confirms sellers maintain complete control.
Volume has diminished on recent price declines, suggesting potential selling exhaustion. A volume-price divergence often precedes short-term relief bounces. The outlook remains bearish until price reclaims $90,700 with conviction.
Disclaimer: Coinwaft is a crypto media platform providing cryptocurrency news, analysis, and trading information. The content of this article is for informational purposes only and should not be considered as financial, legal, or investment advice. Readers are advised once again to research or consult a financial expert before making any financial decision.
© 2026 Coinwaft. All Rights Reserved.

Abdul-Raqeeb Hussayn
Abdul-Raqeeb Hussayn
I'm a Web3 content writer with a Web2 marketing background. I create blogs, reports, and market analysis that make complex blockchain concepts clear for readers and credible for investors.
Author profileTrending Today

Bitcoin
BTC
$75,996.19

TRIA
TRIA
$0.02

Hyperliquid
HYPE
$33.37

Zama
ZAMA
$0.03

Solana
SOL
$98.44

Ondo
ONDO
$0.28

Pudgy Penguins
PENGU
$0.01

Sui
SUI
$1.12
newsletter
Busy Wealth
Join the Busy Wealth newsletter that helps thousands of investors get early alpha and understand the crypto market.
By pressing the "Subscribe button" you agree with our Privacy Policy.
Crypto Today