 Coinwaft
Bitcoin Faces $94K Rejection, but Bollinger Bands Signal Upside Toward $100K
Derivatives liquidations and regulatory uncertainty drive Bitcoin lower, but technical indicators suggest a major move is imminent
January 6, 2026 at 9:44 PM
Last updated
January 6, 2026 at 9:44 PM

KEY FACTS
- Bitcoin dropped 2.25% to $91,873 after failing to break $94K resistance amid $507M in liquidations
- John Bollinger identifies classic Bollinger Band squeeze pattern targeting $100K-$107K upside
- Neutral-to-bearish outlook persists until BTC reclaims and holds above $95,000 with volume
Bitcoin dropped sharply from its $94,000 resistance level on Tuesday, falling to approximately $91,873 amid a broader market sentiment shift. The world’s largest cryptocurrency recorded a 2.25% decline in 24 hours despite maintaining a 4.16% weekly gain. The global crypto market cap fell 1.33% during the same period.
The Fear & Greed Index dropped to 49, entering neutral territory from 42 the previous day. Bitcoin dominance slipped to 58.21%, pointing to capital rotation toward altcoins and stablecoins. These metrics preceded the short-term price weakness now observed in the market.
However, John Bollinger, inventor of the Bollinger Bands indicator, identified what he called a near-perfect technical base forming on the BTCUSD chart. He pointed to a classic Bollinger Band squeeze followed by an early breakout, with $100,000 as the first logical upside target.
Leverage Unwind and Regulatory Concerns Drive Selloff
Derivatives markets experienced $523 million in liquidations over 24 hours, with $109 million occurring within a single hour. Long positions accounted for the majority of these liquidations, forcing leveraged traders to sell and amplifying the downturn.
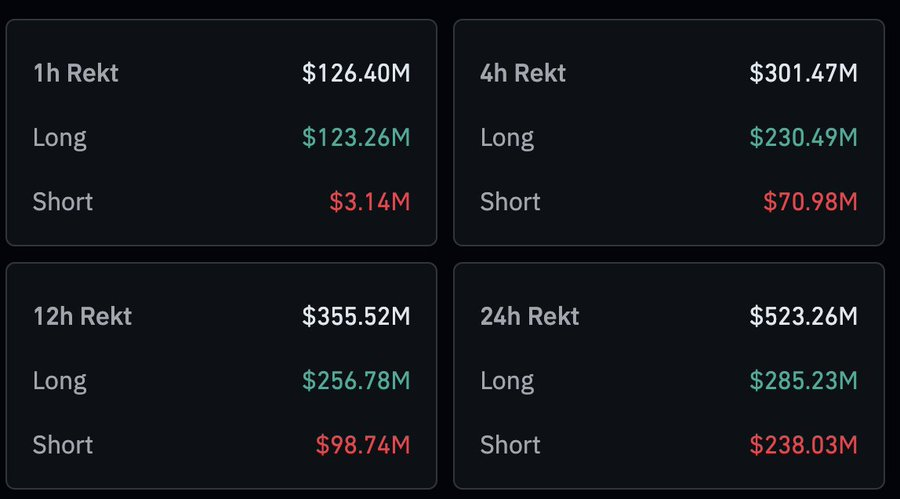
Bitcoin’s price broke below the $95,000 support level during this liquidation cascade, accelerating the drop to $91,500. Rising open interest, up 2.9% in 24 hours, had increased systemic risk prior to the selloff.
Meanwhile, regulatory uncertainty added pressure to the market. An unexpected early High Court decision on tariffs, moved from January 9 to January 6, spooked investors. Looming U.S. employment data scheduled for January 7 and 9 further contributed to the risk-off sentiment.
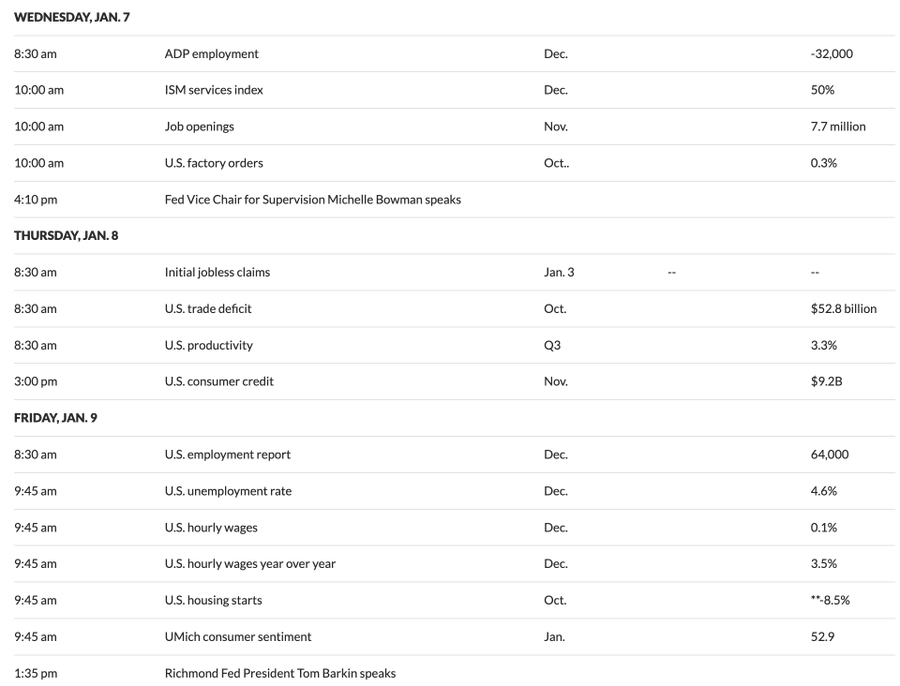
The tariff decision timing shift created a “sell the news” reaction at the $95,000 resistance level. Upcoming jobs reports could influence Federal Reserve policy, affecting crypto’s appeal as a risk asset.
Analysts Eye $100K as Critical Threshold
Bollinger noted that prolonged volatility compression signaled Bitcoin was building energy for a directional move. He identified a secondary target around $107,000 based on historical price structure and band expansion patterns.
According to his chart, If momentum and volatility expansion persist, the market could enter price-discovery territory beyond those levels. He added that failure would mean returning “into the trenches.”
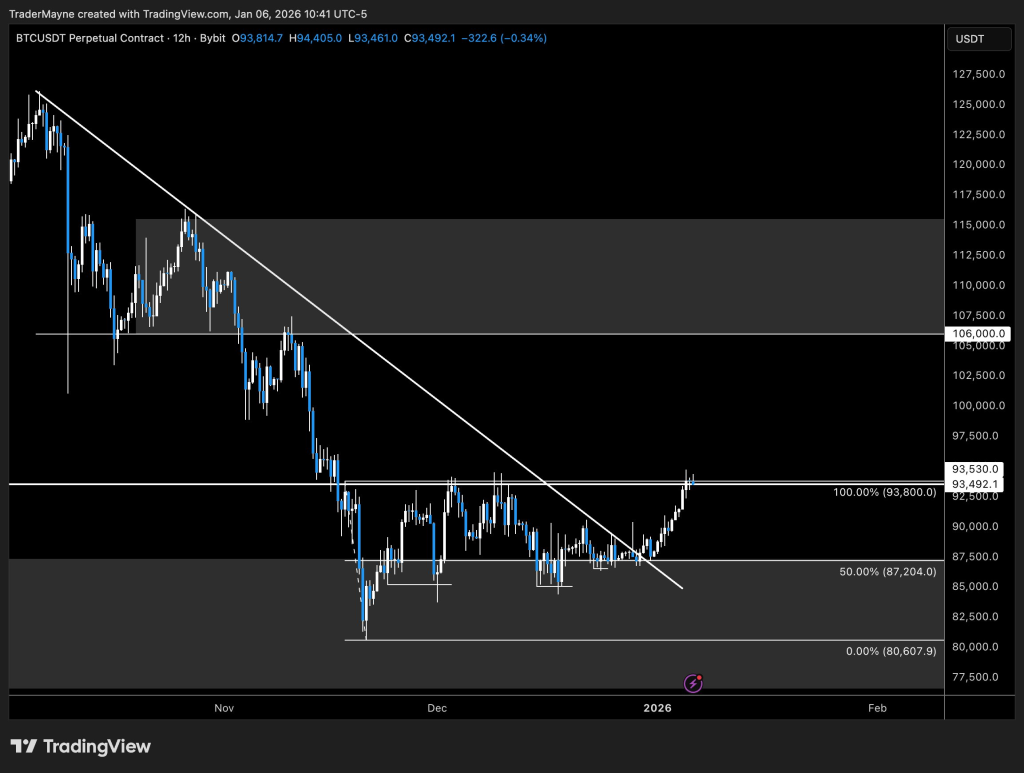
Trader Mayne highlighted that Bitcoin is currently trading at the top of its recent range. He identified the 2025 yearly open as a critical level, stating a sustained move above would likely open the door to $105,000.
Crypto Dan from CryptoQuant explained that the broader crypto market trend hinges on one structural level. The cost basis of coins last updated between six and twelve months ago currently sits near $100,000.
Bitcoin is trading below this level, a condition historically aligned with bearish market phases. Reclaiming this cost basis would mark a meaningful shift in market structure, according to Crypto Dan.
Technical Analysis
Bitcoin is trading at $92,300 on the daily chart, down 1.71% at press time. The price has formed a lower high structure since October, with each rally failing to reclaim previous highs.
Key support levels include the 20-day SMA at $88,715, the recent swing low at $84,781, and the psychological level at $80,000. Resistance zones sit at $92,648-$93,808, followed by $95,000-$96,000 and the $100,000 psychological barrier.
The Bollinger Bands are compressing, with the upper band at $92,648, middle band at $88,715, and lower band at $84,781. Price recently bounced from the lower band and is now testing upper band resistance. This squeeze pattern often precedes significant directional moves.
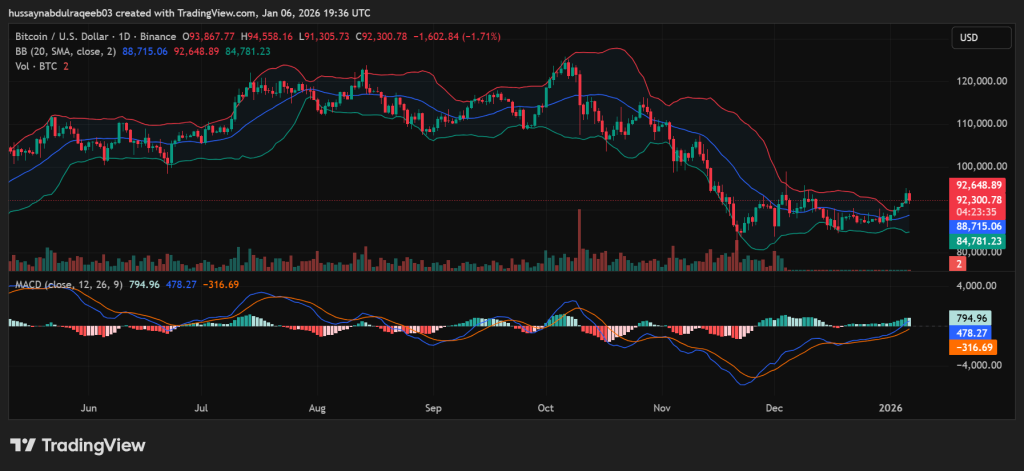
The MACD indicator shows a bullish crossover, with the MACD line at 794.96 crossing above the signal line at 478.27. The histogram is turning green and expanding, marking the first clear bullish signal since November’s decline.
Volume remains inconsistent and declining during recent rallies. Selling volume was elevated during the drop to $84,000, while the current bounce shows only moderate volume without strong buyer conviction.
A clean break above $93,808 with volume could trigger short-covering toward $98,000-$100,000. Rejection at current resistance risks a deeper correction toward $84,000 or potentially $78,000-$80,000. The outlook remains neutral-to-bearish until Bitcoin reclaims and holds above $95,000.
Disclaimer: Coinwaft is a crypto media platform providing cryptocurrency news, analysis, and trading information. The content of this article is for informational purposes only and should not be considered as financial, legal, or investment advice. Readers are advised once again to research or consult a financial expert before making any financial decision.
© 2026 Coinwaft. All Rights Reserved.

Abdul-Raqeeb Hussayn
Abdul-Raqeeb Hussayn
I'm a Web3 content writer with a Web2 marketing background. I create blogs, reports, and market analysis that make complex blockchain concepts clear for readers and credible for investors.
Author profileTrending Today

Bitcoin
BTC
$76,630.73

TRIA
TRIA
$0.02

Hyperliquid
HYPE
$33.45

Solana
SOL
$99.08

River
RIVER
$13.47

Pudgy Penguins
PENGU
$0.01

Zama
ZAMA
$0.03

Bittensor
TAO
$197.32
newsletter
Busy Wealth
Join the Busy Wealth newsletter that helps thousands of investors get early alpha and understand the crypto market.
By pressing the "Subscribe button" you agree with our Privacy Policy.
Crypto Today