 Coinwaft
Bitcoin Holds at $68K as Adjusted SOPR Signals Potential Selling Pressure Ahead
On-chain metric drops to levels last seen during 2019 and 2023 bear markets as ETF outflows accelerate
11 hours ago
Last updated
11 hours ago

KEY FACTS
- Bitcoin trades at $68,177 as aSOPR drops to 0.92-0.94, a zone historically linked to major bear market stress points
- Spot Bitcoin ETFs recorded $380 million in weekly outflows while $90 million in liquidations hit the market
- Technical analysis shows bearish structure with key support at $67,300 and resistance at $73,000-$75,000
Bitcoin steadied near $68,000 as a key on-chain metric dropped into historically significant stress territory. The Adjusted Spent Output Profit Ratio (aSOPR) fell to the 0.92–0.94 zone, a level that previously marked major bear market stress points in 2019 and 2023.
The leading cryptocurrency traded at $68,177.53, down 0.8% in the past 24 hours and 3.1% over the week. Its market capitalization declined 0.7% to $1.36 trillion amid broad risk-off sentiment across digital assets.
Meanwhile, spot Bitcoin ETFs recorded substantial outflows. Data from lookonchain showed daily net outflows of 1,444 BTC worth $98.86 million. Weekly outflows reached 5,555 BTC, totaling $380.44 million over seven days.
The CMC Fear & Greed Index sat at 12, placing market sentiment firmly in “Extreme Fear” territory. The total crypto market cap fell 0.61% to $2.33 trillion, dragging Bitcoin lower alongside the broader market decline.
Bitcoin On-Chain Metrics Flash Warning Signals
The aSOPR reading below 1.0 means coins are being spent at a loss across the network. Historical data shows multiple cycle lows formed around the 0.92–0.93 range during prior bear market transitions.
Unlike mid-cycle pullbacks where aSOPR quickly reclaims 1.0, the current move shows sustained weakness and continued loss realization. This structural deterioration resembles patterns seen during prior bear transition phases.
True bottoms historically form when aSOPR deeply compresses, loss realization peaks, and selling pressure exhausts. The market currently sits in stress territory but has not yet reached extreme capitulation levels.
Deribit chief commercial officer Jean-David Péquignot stated Bitcoin must reclaim $85,000 to repair its long-term rally structure. He identified critical support at $60,000 with a potential final bottom near $58,000.
Bitcoin Liquidations Amplify Downward Pressure
The price breakdown triggered $90.85 million in BTC liquidations over 24 hours. Long positions accounted for $68.07 million of those liquidations, forcing over-leveraged bullish traders to close positions.
Bitcoin broke below its 7-day Simple Moving Average of $68,499.58 and its 30-day SMA of $68,719.64. The RSI-14 reading of 40.34 showed oversold conditions without reaching extreme levels.
The immediate battleground centers on the recent swing low at $67,301.58. A breakdown below this level opens the path toward Fibonacci support at $67,984.96 and potentially lower targets.
Following the high-volume capitulation event, trading activity declined on stabilization candles. No strong accumulation volume emerged on bounce attempts, leaving buying conviction unconfirmed.
Bitcoin Technical Analysis Remains Bearish
Bitcoin faces a confirmed downtrend since November 2025, with clear lower highs and lower lows forming on the chart. The most recent lower high formed near $100,000 in January 2026, with the current lower low testing $67,936.
Price currently hugs the lower Bollinger Band at $59,499 while the 20 SMA sits 7.5% higher at $73,061. This compression zone typically precedes major directional moves in either direction.
The MACD remains deeply negative with a histogram reading of -5,185.82. Both MACD and Signal lines hold bearish crossover configuration, though recent histogram bars show reduced selling pressure.
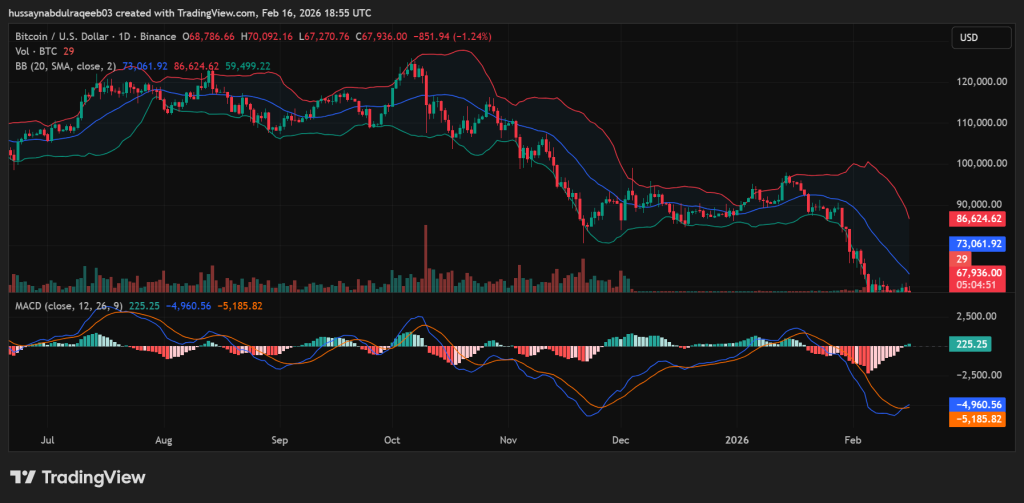
Key resistance levels include $73,000-$75,000 at the 20 SMA zone and $86,000-$88,000 at the upper Bollinger Band. Support sits at $63,000 representing the 0.786 Fibonacci retracement and $59,000-$60,000 at the lower Bollinger Band.
Fibonacci analysis places Bitcoin at the 78.6% retracement level, deep correction territory. Moves beyond this threshold historically suggest major trend exhaustion with full retracement risk elevated.
The near-term trajectory remains bearish. A hold above $67,300 could trigger relief toward $73,000-$75,000 resistance. A decisive break lower targets $59,000-$60,000 before potential stabilization.
Disclaimer: Coinwaft is a crypto media platform providing cryptocurrency news, analysis, and trading information. The content of this article is for informational purposes only and should not be considered as financial, legal, or investment advice. Readers are advised once again to research or consult a financial expert before making any financial decision.
© 2026 Coinwaft. All Rights Reserved.

Abdul-Raqeeb Hussayn
Abdul-Raqeeb Hussayn
I'm a Web3 content writer with a Web2 marketing background. I create blogs, reports, and market analysis that make complex blockchain concepts clear for readers and credible for investors.
Author profileTrending Today

Bitcoin
BTC
$67,612.46

River
RIVER
$9.96

Venice Token
VVV
$4.41

Bittensor
TAO
$194.02

XRP
XRP
$1.48

Solana
SOL
$85.24

Pudgy Penguins
PENGU
$0.01

Pi Network
PI
$0.18
newsletter
Busy Wealth
Join the Busy Wealth newsletter that helps thousands of investors get early alpha and understand the crypto market.
By pressing the "Subscribe button" you agree with our Privacy Policy.
Crypto Today