 Coinwaft
Bitcoin Jumps to $89K After Trump Walks Back 10% Tariff — Is More Upside Ahead?
The tariff reversal triggered a $1,800 price jump in 30 minutes, liquidating $202 million in shorts, while ETF outflows persist and technical indicators signal caution.
January 23, 2026 at 8:03 AM
Last updated
January 23, 2026 at 8:03 AM

KEY FACTS
- Bitcoin surged to $89,000 after President Trump reversed his decision to impose 10% tariffs on the EU, liquidating $202 million in shorts.
- Bitcoin ETFs recorded $874.65 million in net outflows over 24 hours despite the price recovery.
- Technical indicators show bearish structure remains intact with resistance at $92,000-$97,000 and support at $87,000.
Bitcoin surged past $89,000 on January 22, 2026, after President Donald Trump reversed his decision to impose 10% tariffs on the European Union. The tariffs were originally scheduled to take effect on February 1. Following the announcement, the leading cryptocurrency jumped $1,800 within 30 minutes, sparking speculation about a potential market turnaround.
At the time of writing, Bitcoin traded at $89,262.65, marking a 2.05% increase from its 24-hour low near $87,000. However, the asset remains down 7.57% over the past week. The rally liquidated $202 million in short positions as the price spiked from $87,300 to $90,500.
The tariff suspension followed high-level discussions between U.S. leadership and NATO officials. Talks with NATO Secretary General Mark Rutte produced a preliminary framework for a broader strategic agreement involving Greenland and the Arctic region.

Bitcoin Gains as Global Markets Rally on Tariff Suspension
The decision to suspend tariffs reduced near-term geopolitical and trade uncertainty across global markets. Precious metals sold off sharply, while equities and cryptocurrencies responded positively.
Major indices posted gains across the board. The Nasdaq climbed 1.16%, while the S&P 500 rose 1.17%. The Dow Jones gained 1.22%, and the Russell 2000 surged 1.95% to hit a new all-time high.
Senior U.S. officials, including the vice president, secretary of state, and special envoys, were assigned to lead ongoing negotiations. Further discussions regarding Arctic-related security initiatives remain in progress.
Meanwhile, President Trump stated that Congress is working on a crypto market structure bill. He expressed hope to sign it soon, adding that he is ensuring America remains the crypto capital of the world.
Bitcoin ETF Outflows Persist as Cycle Analysis Points to Bear Market
Bitcoin ETFs continue experiencing significant outflows despite the price recovery. According to Lookonchain data, Bitcoin ETFs recorded a one-day net outflow of 9,762 BTC, valued at approximately $874.65 million.
The seven-day net outflow reached 16,144 BTC, totaling $1.45 billion. BlackRock’s IBIT and Grayscale combined for over 5,000 BTC in net outflows within the last 24 hours alone.
Analyst Rekt Capital noted that the second year of Bitcoin’s four-year cycle has begun with 2026 underway. Historical patterns suggest 2025 marked the bull market peak, with 2026 likely serving as a bear market year.
According to Rekt Capital, 2027 should function as the bottoming phase before a new bull market emerges. This cycle analysis places the current market in a correction phase.
On January 22, 2026, Michael Saylor’s company Strategy hinted at another imminent Bitcoin purchase. The company’s holdings have surpassed 709,000 BTC. Saylor posted on X, stating he is thinking about buying more bitcoin.
Bitcoin Price Faces Key Support Levels as RSI Nears Oversold Territory
Bitcoin’s daily chart reveals the asset trading below all major moving averages, with the 9-day EMA at $91,490.51 and the 20-day SMA at $92,367.85. The price sits near the lower Bollinger Band at $87,568.15.
The 7-day RSI stands at 34.52, approaching oversold territory below 30. This level historically suggests selling exhaustion and potential for mean reversion toward the middle Bollinger Band.
Key support levels include $87,568 at the lower Bollinger Band and the $85,000-$87,000 zone. A break below $87,000 could accelerate selling pressure toward $80,000-$84,000.
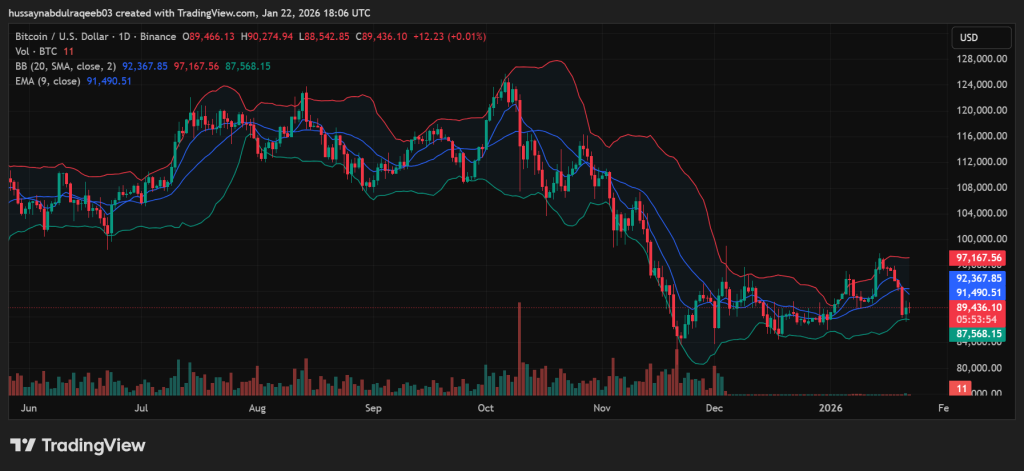
Resistance levels cluster between $91,490 at the 9-day EMA and $97,168 at the upper Bollinger Band. The psychological $100,000 level and the $108,000-$112,000 zone present additional overhead resistance.
Volume analysis shows inconsistent participation with recent spikes during declines, suggesting distribution pressure. Lower volume during bounces indicates weak buying conviction at current levels.
The most likely near-term scenario points to a short-term bounce toward the $92,000-$97,000 resistance zone. However, the bearish trend structure remains intact until Bitcoin reclaims $100,000 with conviction and volume. Price trajectory remains bearish until bulls can flip the moving average structure.
Disclaimer: Coinwaft is a crypto media platform providing cryptocurrency news, analysis, and trading information. The content of this article is for informational purposes only and should not be considered as financial, legal, or investment advice. Readers are advised once again to research or consult a financial expert before making any financial decision.
© 2026 Coinwaft. All Rights Reserved.

Abdul-Raqeeb Hussayn
Abdul-Raqeeb Hussayn
I'm a Web3 content writer with a Web2 marketing background. I create blogs, reports, and market analysis that make complex blockchain concepts clear for readers and credible for investors.
Author profileTrending Today

Bitcoin
BTC
$76,630.73

TRIA
TRIA
$0.02

Hyperliquid
HYPE
$33.45

Solana
SOL
$99.08

River
RIVER
$13.47

Pudgy Penguins
PENGU
$0.01

Zama
ZAMA
$0.03

Bittensor
TAO
$197.32
newsletter
Busy Wealth
Join the Busy Wealth newsletter that helps thousands of investors get early alpha and understand the crypto market.
By pressing the "Subscribe button" you agree with our Privacy Policy.
Crypto Today