 Coinwaft
Bitcoin Reclaims $68K as Spot Demand Surges for the First Time Since November — Can the Rally Sustain?
CryptoQuant data signals selling pressure exhaustion as Bitcoin ETFs record $247M daily inflow, but short-term holder losses persist for 30 straight days
10 hours ago
Last updated
10 hours ago

KEY FACTS
- Bitcoin surged 4.54% to reclaim $68,000 as spot demand turned positive for the first time since late November
- Bitcoin ETFs recorded daily inflows of +3,732 BTC ($247.72M), though weekly flows remain negative at -2,285 BTC
- On-chain metrics show selling pressure exhaustion, but short-term holders have sold at a loss for 30 consecutive days
Bitcoin surged past $68,000 on Wednesday, posting a 4.54% gain in 24 hours as spot demand turned positive for the first time since late November. The flagship cryptocurrency now trades at $68,242.52, with its market cap climbing to $1.36 trillion from $1.3 trillion the previous day.
CryptoQuant’s Head of Research Julio Moreno confirmed the shift in spot demand dynamics, signaling exhaustion of sell pressure.
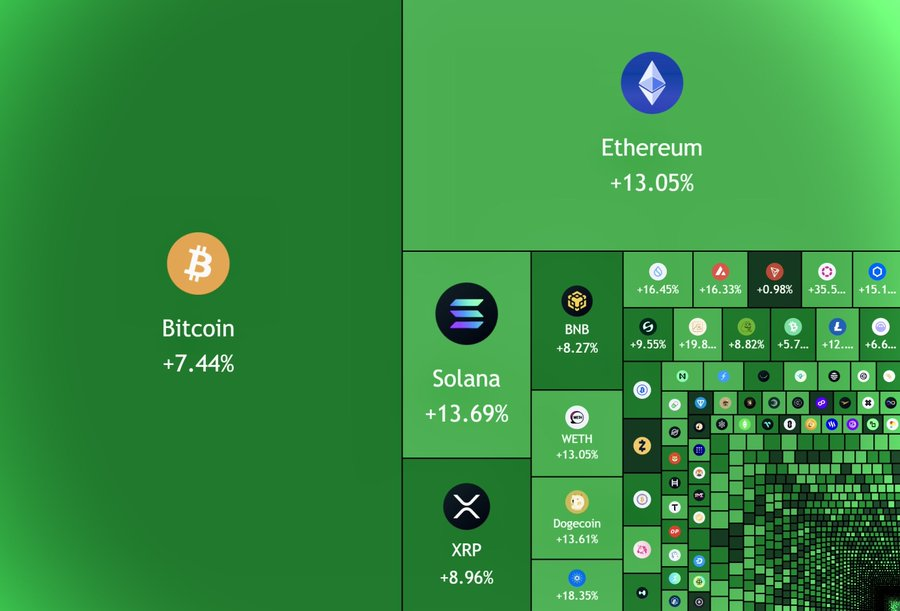
The development comes amid a broader crypto market rally that added over $170 billion in total market capitalization, pushing it above $2.4 trillion. Solana led altcoin gains with a 12% surge in 24 hours. Ethereum followed with gains between 8% and 10% during the same period.
According to Lookonchain, Bitcoin ETFs recorded significant inflows, with daily net flows reaching +3,732 BTC worth $247.72 million. However, the seven-day net flow for Bitcoin ETFs remained negative at -2,285 BTC, representing $151.65 million in outflows. This mixed signal raises questions about the rally’s sustainability.
Bitcoin’s On-Chain Metrics Paint a Cautious Picture
The Fund Flow Ratio currently sits at 0.012, a notably low level. This metric tracks BTC flowing into Binance relative to total holdings on the exchange. Fewer coins moving to exchanges typically reduces immediate sell-side pressure.
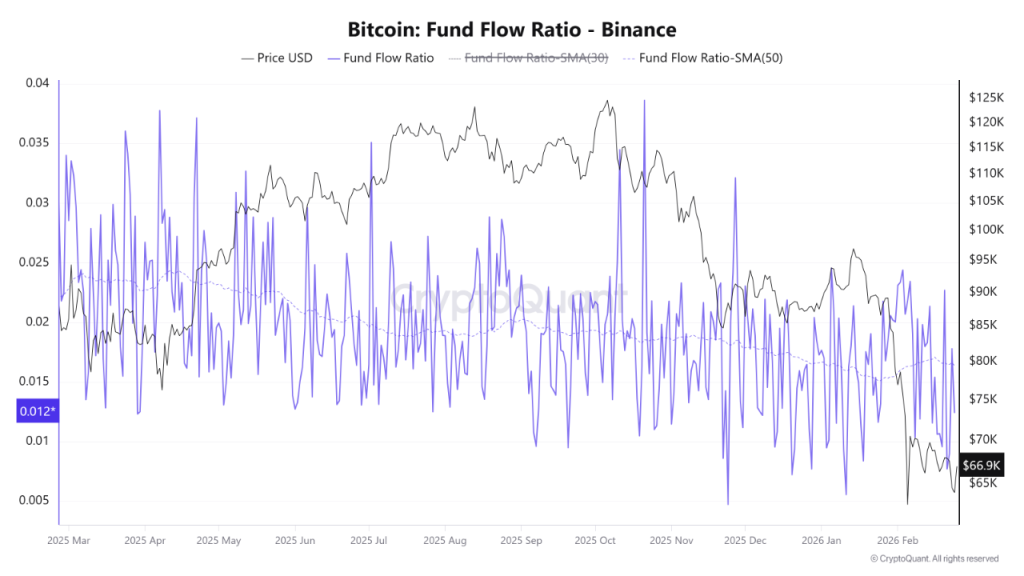
Binance’s deep liquidity makes it a preferred venue for institutional transfers. The low fund flow ratio at this exchange carries significant weight in market analysis. Both the 30-day and 50-day simple moving averages continue sloping downward.
Despite the sharp price decline to $66,000 earlier, the Fund Flow Ratio did not spike. During typical selloffs, this metric rises sharply as coins flood exchanges. The absence of such a spike points to derivatives and liquidations driving the recent decline rather than aggressive spot selling.
Short-term holders have been selling at a loss for 30 consecutive days. CryptoQuant data shows the STH Profit & Loss metric has remained negative since January 26. Two capitulation events occurred on February 5 and February 21, each showing -8K spikes that were subsequently absorbed.
Bitcoin Rally Faces Mixed Signals From Holders and Institutions
Market observers remain divided on the nature of this bounce. The current setup may slow downside momentum and create conditions for a relief rally. If the Fund Flow Ratio stays low, any upward price movement could trigger a short squeeze.
Meanwhile, critics point to the persistent negative readings in short-term holder metrics. Until these indicators flip green and hold, some analysts argue that each Bitcoin pump represents exit liquidity rather than genuine accumulation.
The weekly ETF outflows contrast with daily inflows, creating uncertainty about institutional conviction. The broader altcoin rally, led by Solana and Ethereum, suggests risk appetite has returned temporarily to crypto markets.
Bitcoin Price Levels and Indicators
Bitcoin trades near the middle Bollinger Band at $67,859 on the daily chart. The upper band sits at $71,043, representing immediate overhead resistance. Support rests at the lower band near $64,676.
The Bollinger Bands experienced massive expansion during February’s selloff to $63,000. Price touched the lower band at that level, triggering an oversold signal. Holding above the middle band would establish bullish structure; losing it would invite another test of lows.
MACD readings show the histogram turning less negative at -3,920.66. The MACD line at 704.64 is beginning to curl upward but remains below the signal line at -3,216.02. A bullish crossover has not yet confirmed.
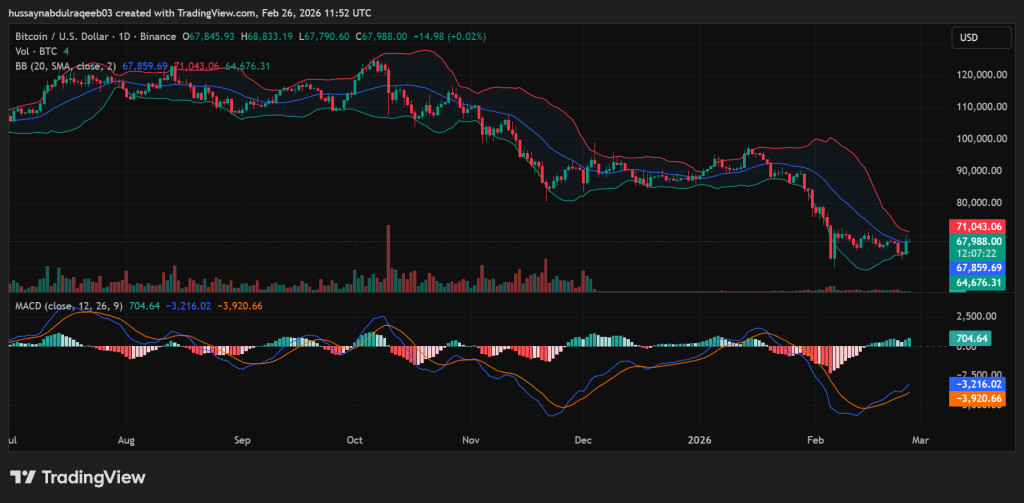
Volume analysis reveals climactic selling during mid-February’s capitulation. Current recovery volume remains lower than the panic selling phase. Strong buyer conviction has not yet materialized in volume metrics.
Key resistance levels align at $75,000 to $76,500, representing the 0.236 Fibonacci retracement from the $120,000 high. Further resistance sits at $84,000, the 0.382 Fibonacci level. Support holds at $65,000, with $63,000 marking the recent capitulation low.
The current setup suggests a neutral-to-tentatively-bullish stance. A break above $71,000 would signal strength, while failure below $65,000 would negate recovery attempts. Short-term trajectory remains range-bound with slight upward bias pending confirmation signals.
Disclaimer: Coinwaft is a crypto media platform providing cryptocurrency news, analysis, and trading information. The content of this article is for informational purposes only and should not be considered as financial, legal, or investment advice. Readers are advised once again to research or consult a financial expert before making any financial decision.
© 2026 Coinwaft. All Rights Reserved.

Abdul-Raqeeb Hussayn
Abdul-Raqeeb Hussayn
I'm a Web3 content writer with a Web2 marketing background. I create blogs, reports, and market analysis that make complex blockchain concepts clear for readers and credible for investors.
Author profileTrending Today

Bitcoin
BTC
$65,479.36

Fabric Protocol
ROBO
$0.04

Terra Luna Classic
LUNC
$0

Venice Token
VVV
$4.4

Ethereum
ETH
$1,914.35

Solana
SOL
$81.25

Canton
CC
$0.17

Aave
AAVE
$111.69
newsletter
Busy Wealth
Join the Busy Wealth newsletter that helps thousands of investors get early alpha and understand the crypto market.
By pressing the "Subscribe button" you agree with our Privacy Policy.
Crypto Today