 Coinwaft
XRP Holds $1.45 as Fifth Straight Red Month Mirrors 2016 Setup Before Historic Surge — Will History Repeat?
Rare five-month red candle pattern mirrors 2016 setup that preceded XRP's legendary 60,000% rally from $0.0055 to $3.31
10 hours ago
Last updated
10 hours ago

KEY FACTS
- XRP trades at $1.43 as it nears its fifth consecutive red monthly candle, a pattern last seen in 2016
- The 2016 five-month red streak preceded a 60,000% rally from $0.0055 to $3.31
- Technical indicators show early momentum recovery signs with key resistance at $1.50-$1.51
XRP has consolidated around the $1.45 level as the token approaches its fifth consecutive red monthly candle. This rare pattern last appeared in 2016, just before XRP surged over 60,000% from $0.0055 to $3.50.
The Ripple-issued token currently trades at $1.43, up 1.28% in 24 hours and 3.24% over the past week. However, XRP remains down 23.78% from its $1.90 close last month. Its market cap now sits at approximately $87.85 billion.
The broader crypto market has rallied, adding over $170 billion in total capitalization and pushing above $2.4 trillion. Solana led altcoin gains with a 12% surge in 24 hours. Ethereum followed with 8%-10% gains, while Bitcoin rose 4%-7%.
XRP’s 2016 Five-Month Red Streak Preceded 60,000% Rally
Market analyst Caesar has identified XRP’s current trajectory as a powerful historical signal. The asset is on pace to record five consecutive red monthly candles, a setup not seen since 2016.
During that brutal 2016 stretch, XRP dropped 37%, sliding from $0.0088 to $0.0055. The token traded below a penny, sentiment collapsed, and almost no one called a bottom. The prolonged grind lower flushed out weak hands.
From March 2017 to January 2018, XRP exploded to $3.31, delivering a 60,000% gain in under a year. The surge transformed the overlooked token into one of the best-performing assets of the entire crypto bull market.
After peaking at $2.84 in October, XRP has declined to roughly $1.44. A red February close would seal its first five-month losing streak since 2016. Sentiment has cooled significantly from peak-cycle euphoria.
XRP Market Psychology Points to Potential Seller Exhaustion
Extended declines often signal seller exhaustion. Speculation wanes while long-term holders quietly accumulate. Historically, such compression phases have preceded major rallies in crypto markets.
The potential upside carries striking implications. If XRP mirrors its 2017-2018 surge proportionally, current levels could theoretically reach extraordinary heights. Such moves would require massive capital inflows and favorable macro conditions.
XRP recently recorded its largest on-chain realized loss since 2022. This data point suggests the market may be approaching a pivotal turning point as sellers capitulate.
The 2017 rally rode a wave of retail mania and minimal regulation. Today, XRP trades in a more mature, institutional, and tightly monitored market environment.
Still, five consecutive red months remain exceptionally rare for XRP. The last occurrence preceded one of crypto’s most historic surges.
XRP Price Structure Shows Oversold Signals Amid Consolidation
XRP’s daily chart displays a clear downtrend from its $3.50 peak through February, representing approximately 60% depreciation. The price structure shows consistent lower highs at $2.80, $2.50, $2.30, and $2.00.
Bollinger Bands show the upper band at $1.51, middle band at $1.42, and lower band at $1.34. Price recently pierced the lower band around $1.25, a classic oversold signal. Band width expansion indicates extreme volatility.
The MACD presents early momentum recovery signs. The MACD line reads 0.0177 while the signal line sits at -0.0712. A bullish crossover is forming, though both lines remain in negative territory below zero.
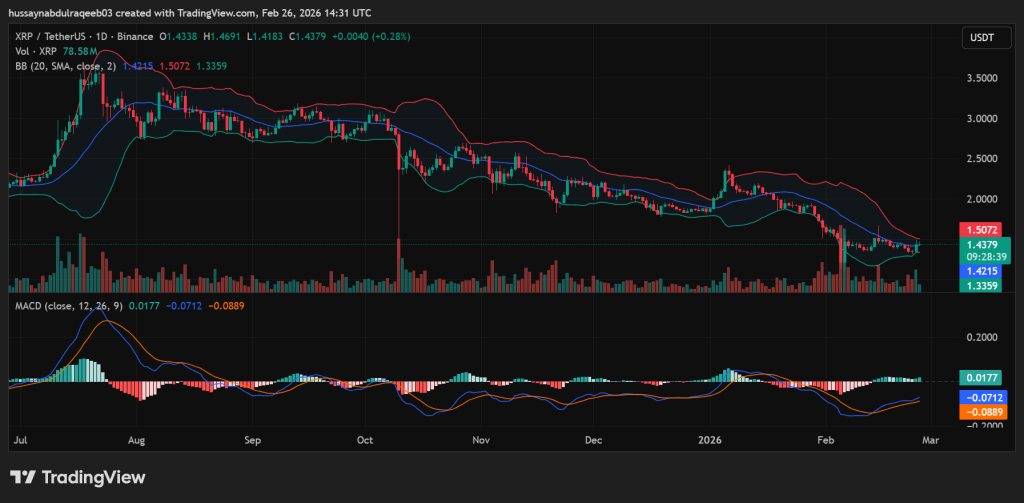
Key resistance levels stand at $1.50-$1.51 (upper Bollinger Band), $1.65-$1.70 (previous breakdown structure), and $2.00 (major psychological barrier). Support sits at $1.40-$1.42 (20 SMA) and $1.25-$1.30 (recent swing low).
Volume analysis reveals a capitulation spike during the February selloff. Subsequent bounce shows moderate but unenthusiastic buying pressure. Any breakout above $1.50 requires volume expansion for validity.
The current consolidation range spans $1.33 to $1.51, developing over two to three weeks. Price trajectory remains bearish until a sustained break above the 20 SMA and upper Bollinger Band confirms structural shift.
Disclaimer: Coinwaft is a crypto media platform providing cryptocurrency news, analysis, and trading information. The content of this article is for informational purposes only and should not be considered as financial, legal, or investment advice. Readers are advised once again to research or consult a financial expert before making any financial decision.
© 2026 Coinwaft. All Rights Reserved.

Abdul-Raqeeb Hussayn
Abdul-Raqeeb Hussayn
I'm a Web3 content writer with a Web2 marketing background. I create blogs, reports, and market analysis that make complex blockchain concepts clear for readers and credible for investors.
Author profileTrending Today

Bitcoin
BTC
$65,479.36

Fabric Protocol
ROBO
$0.04

Terra Luna Classic
LUNC
$0

Venice Token
VVV
$4.4

Ethereum
ETH
$1,914.35

Solana
SOL
$81.25

Canton
CC
$0.17

Aave
AAVE
$111.69
newsletter
Busy Wealth
Join the Busy Wealth newsletter that helps thousands of investors get early alpha and understand the crypto market.
By pressing the "Subscribe button" you agree with our Privacy Policy.
Crypto Today