 Coinwaft
Bitcoin Slides Toward $90K as U.S. 10Y Yields Hit 4.3% — More Dump Ahead?
Rising Treasury yields and fresh U.S. tariffs on EU imports trigger broad crypto selloff as $215 billion evaporates from market cap
13 hours ago
Last updated
13 hours ago

KEY FACTS
- Bitcoin dropped below $90,000 as U.S. 10-year Treasury yields hit 4.30% and Trump announced 10% tariffs on EU imports.
- The crypto market lost $215 billion while over $150 million in BTC longs were liquidated within 24 hours.
- Technical analysis points to continued bearish pressure with key support at $85,000-$87,000.
Bitcoin dropped below $90,000 as U.S. 10-year Treasury yields climbed to 4.30% for the first time since September. The world’s largest cryptocurrency now trades at $89,608, down 3.8% in 24 hours and nearly 4% over the past week.
The selloff erased approximately $215 billion from the total crypto market capitalization. Rising yields and escalating trade tensions between the U.S. and European Union triggered a broad flight from risk assets across global markets.
Meanwhile, traditional safe havens surged to record highs. Gold futures hit $4,700 per ounce while silver broke above $95 per ounce for the first time in history. Since the start of 2026, gold has added roughly $2.7 trillion in market value.
Trump’s Tariff Threats Rattle Markets, Drag BTC Lower
President Trump announced fresh 10% tariffs on EU imports over the weekend. The move targets Denmark, Norway, Germany, France, Sweden, Finland, the Netherlands, and the U.K. over resistance to a U.S. purchase of Greenland.
Potential escalations include hikes to 25% by June and 200% duties on French wine. This marks the first major tariff escalation in nearly three months, threatening trade flows worth approximately $1.5 trillion.
Following this announcement, European leaders activated what Le Monde described as “trade bazooka” defenses. The geopolitical tensions pushed investors toward traditional safe havens while pressuring risk assets including cryptocurrencies.
U.S. equity markets felt the impact sharply. The Dow dropped 1.5%, the S&P 500 fell 1.2% to around 6,860, and the Nasdaq slid 1.6%. Tech giants Nvidia, Microsoft, Apple, Amazon, and Tesla each lost 2-3%.
The VIX fear gauge surged nearly 28% above the 20 level. Markets worried about a broader trade war echoing 2018 tensions when similar escalations disrupted global financial markets.
Bitcoin ETF Outflows Hit $261 Million as BTC Liquidations Surge
Bitcoin ETFs recorded a daily net outflow of 2,886 BTC, equivalent to $261.68 million. However, the seven-day inflow remains positive at 14,760 BTC, or $1.34 billion, according to Lookonchain data.
Over $150 million in BTC long positions were liquidated within 24 hours, a 16% increase from the prior day. Open interest stood at $719 billion, amplifying downside pressure as forced liquidations triggered a selling cascade.
Bitcoin’s 24-hour trading volume surged 16.08% to $46.7 billion during the selloff. The price breakdown accelerated after BTC fell below the critical $91,000 support level.
Despite the downturn, Strategy CEO Michael Saylor announced his company acquired 22,305 BTC for approximately $2.13 billion at $95,284 per bitcoin. As of January 19, 2026, Strategy holds 709,715 BTC acquired for $53.92 billion at an average price of $75,979.
BTC Breaks Below Key Support as Bearish Signals Mount
Bitcoin trades at $89,687, down 3.16% on the session. The price broke below the 20-day simple moving average at $92,424 and now approaches the lower Bollinger Band at $87,772.
The MACD indicator confirms bearish momentum. The MACD line reads 869.11 against a signal line of 1,081.34, producing a negative histogram of -212.22. The bearish crossover signals deteriorating momentum.
Key support levels include the lower Bollinger Band at $87,772 and the psychological zone between $85,000 and $87,000. Resistance now sits at the 20-day SMA of $92,424 and the upper Bollinger Band at $97,075.
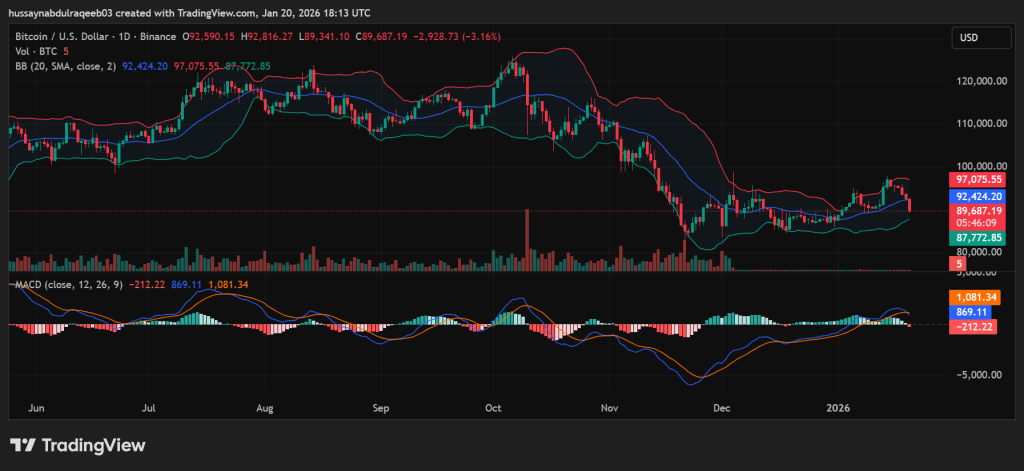
A head-and-shoulders pattern formed between October and December, with the breakdown below the neckline support at $92,000-$93,000 now confirmed. High volume accompanies the decline, suggesting strong conviction selling.
The 200-day SMA sits at $105,734, representing an 18% gap above current prices. For bullish reversal, Bitcoin must reclaim $92,424 with volume and produce a MACD bullish crossover.
The immediate price trajectory remains bearish. Targets include $85,000-$87,000 initially, with $80,000 and $75,000-$78,000 as secondary downside levels if selling pressure continues.
Disclaimer: Coinwaft is a crypto media platform providing cryptocurrency news, analysis, and trading information. The content of this article is for informational purposes only and should not be considered as financial, legal, or investment advice. Readers are advised once again to research or consult a financial expert before making any financial decision.
© 2026 Coinwaft. All Rights Reserved.

Abdul-Raqeeb Hussayn
Abdul-Raqeeb Hussayn
I'm a Web3 content writer with a Web2 marketing background. I create blogs, reports, and market analysis that make complex blockchain concepts clear for readers and credible for investors.
Author profileTrending Today
Seeker
SKR
$0.02
ETHGas
GWEI
$0.03

Oasis
ROSE
$0.02

Ondo
ONDO
$0.35

River
RIVER
$47.18

Solana
SOL
$131.07

Pudgy Penguins
PENGU
$0.01

Zcash
ZEC
$369.16
newsletter
Busy Wealth
Join the Busy Wealth newsletter that helps thousands of investors get early alpha and understand the crypto market.
By pressing the "Subscribe button" you agree with our Privacy Policy.
Crypto Today