 Coinwaft
Ethereum Dips Below $3K Despite Strong On-Chain Growth — What Comes Next?
Trade war fears spark broad selloff as ETH breaks key support despite record network activity and rock-bottom fees
13 hours ago
Last updated
13 hours ago

KEY FACTS
- Ethereum fell 7.15% below $3,000 as U.S.-EU trade tensions triggered a $215 billion crypto market selloff.
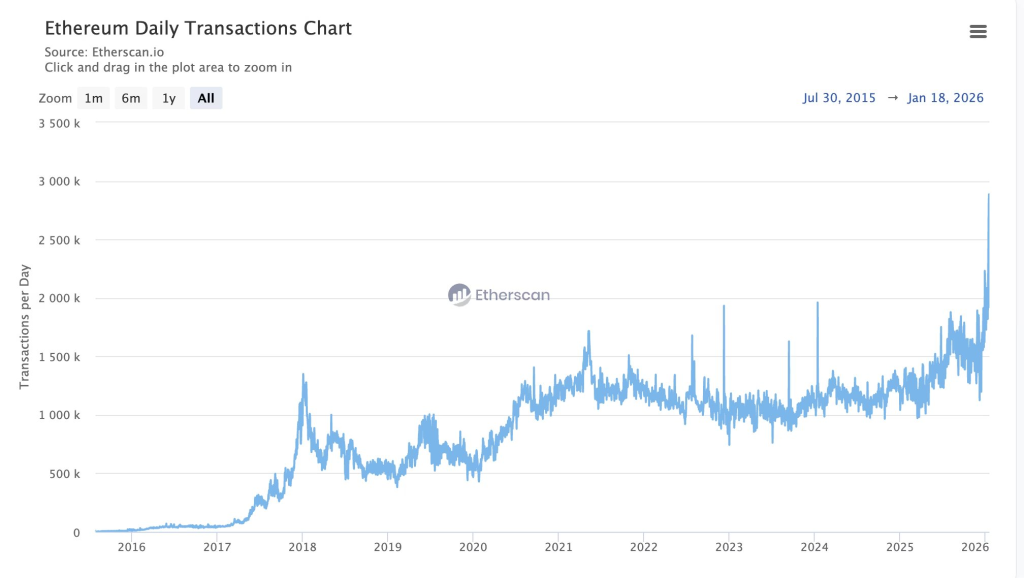
- On-chain metrics remain strong with record 2.5 million daily transactions and gas fees at historic lows of $0.04-$0.15.
- Technical indicators show bearish momentum with the critical $2,900 support level at the 200-day SMA now in focus.
Ethereum fell below the $3,000 mark on January 20, 2026, dropping 7.15% in 24 hours to trade at $2,987.45. The decline came despite the network processing record-high daily transactions and offering historically low gas fees.
The market cap slid to $361.28 billion, also reflecting a 7% decrease. This selloff erased approximately $215 billion from the total crypto market capitalization as investors fled risk assets amid escalating macroeconomic tensions.
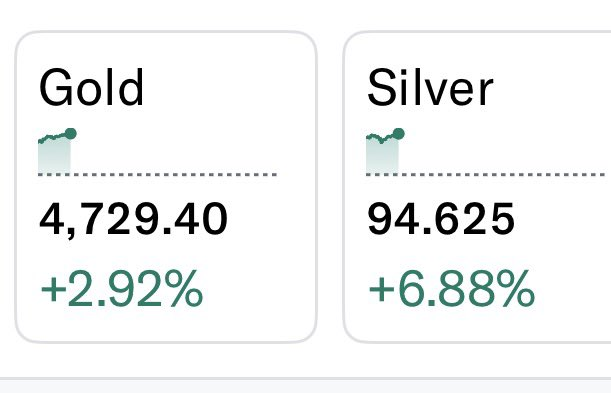
Rising U.S. Treasury yields and fresh trade conflict between the U.S. and European Union triggered the broad market retreat. Traditional safe havens surged, with gold futures hitting $4,700 per ounce and silver breaking above $95 per ounce for the first time in history.
Ethereum’s Impressive Record Activity and Low Fees
Ethereum’s seven-day moving average of transactions is nearing 2.5 million, a record high nearly double its value from one year ago. Transaction activity has surged significantly since mid-December.
Average gas fees have fallen to significant lows. There has been a average transaction costs around $0.15, the lowest in the network’s modern history. Etherscan gas data pegs estimated fees even lower, averaging around $0.04 for a swap on Sunday.
The surge in activity comes seven weeks after Ethereum’s Fusaka hard fork went live. The upgrade introduced PeerDAS and initiated the network’s new twice-a-year upgrade schedule. The Blob Parameters Only fork, deployed January 8, pushed the blob target to 14 and maximum cap to 21.
Ethereum’s block gas limit rose from 45 million to 60 million in late November, a 100% increase from the start of 2025. As execution has shifted to Layer 2 networks, demand for mainnet blockspace has eased even as overall activity climbs.
Ethereum recorded a daily netflow of 0 ETH. However, the seven-day inflow remains positive at 172,826 ETH, or $523.84 million, according to Lookonchain data.
Tariffs Rattle Global Markets as ETH Slides
President Trump announced 10% tariffs on EU imports over the weekend. The measure targets Denmark, Norway, Germany, France, Sweden, Finland, the Netherlands, and the U.K. over resistance to a U.S. purchase of Greenland.
U.S. equity markets felt the impact sharply following the announcement. The Dow dropped 1.5%, the S&P 500 fell 1.2% to around 6,860, and the Nasdaq slid 1.6%. Tech giants Nvidia, Microsoft, Apple, Amazon, and Tesla each lost 2-3%.
Meanwhile, gold has added roughly $2.7 trillion in market value since the start of 2026. The capital rotation from risk assets to safe havens continues to pressure cryptocurrency valuations.
ETH Breaks Below $3,000 as Bearish Signals Mount
ETH has decisively broken below the $3,000 psychological support level, with the 24-hour low reaching $2,956.90. This level held multiple times since December 2025, making this breach technically significant.
Price is trading at the lower Bollinger Band ($2,965.97), with the middle band at $3,181.42 and upper band at $3,396.88. The bands are narrowing after previous expansion.
The MACD indicator shows a bearish crossover in progress. The MACD line sits at 37.52, below the signal line at 50.59. The histogram reads -13.07, confirming bearish momentum with no signs of bullish divergence.
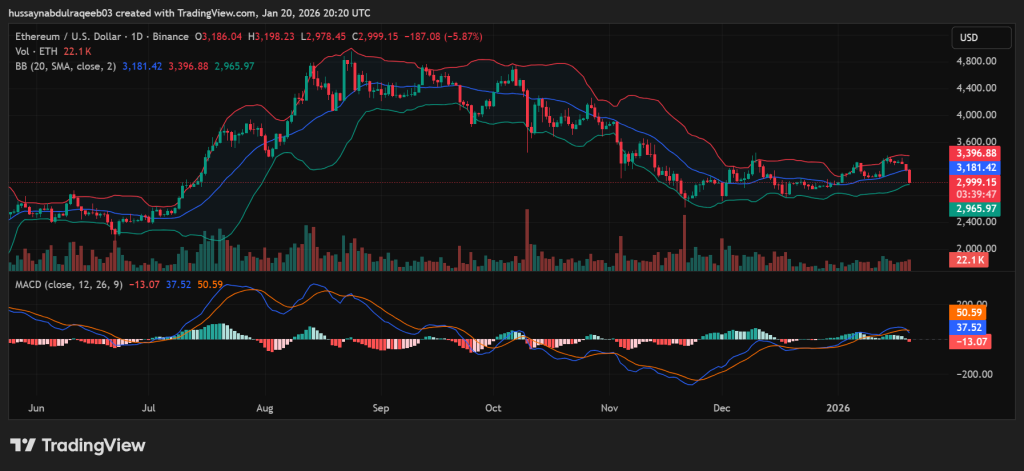
Key resistance levels sit at $3,181 (20-period SMA), $3,300-$3,400 (previous consolidation zone), and $3,600 (October/November highs). Support levels are at $2,965 (lower Bollinger Band), $2,900 (200-day SMA), and $2,800.
Volume spiked during the breakdown, with recent selling volume significantly higher than buying volume. A bearish pennant pattern shows a clean breakdown below the lower trendline.
The critical $2,900 level at the 200-day SMA will likely determine whether this becomes a full correction or controlled retracement. A break below could trigger stop-loss cascades and algorithmic selling. The path of least resistance remains downward until ETH reclaims $3,000 with strong volume confirmation.
Disclaimer: Coinwaft is a crypto media platform providing cryptocurrency news, analysis, and trading information. The content of this article is for informational purposes only and should not be considered as financial, legal, or investment advice. Readers are advised once again to research or consult a financial expert before making any financial decision.
© 2026 Coinwaft. All Rights Reserved.

Abdul-Raqeeb Hussayn
Abdul-Raqeeb Hussayn
I'm a Web3 content writer with a Web2 marketing background. I create blogs, reports, and market analysis that make complex blockchain concepts clear for readers and credible for investors.
Author profileTrending Today
Seeker
SKR
$0.02
ETHGas
GWEI
$0.03

Oasis
ROSE
$0.02

Ondo
ONDO
$0.35

River
RIVER
$47.18

Solana
SOL
$131.07

Pudgy Penguins
PENGU
$0.01

Zcash
ZEC
$369.16
newsletter
Busy Wealth
Join the Busy Wealth newsletter that helps thousands of investors get early alpha and understand the crypto market.
By pressing the "Subscribe button" you agree with our Privacy Policy.
Crypto Today