 Coinwaft
Solana Steadies at $124 as $1.3B in Stablecoins Flow Into the Network.
The network records record staking levels and positive ETF flows as $1.3 billion in stablecoins migrate from Ethereum
6 days ago
Last updated
6 days ago

KEY FACTS
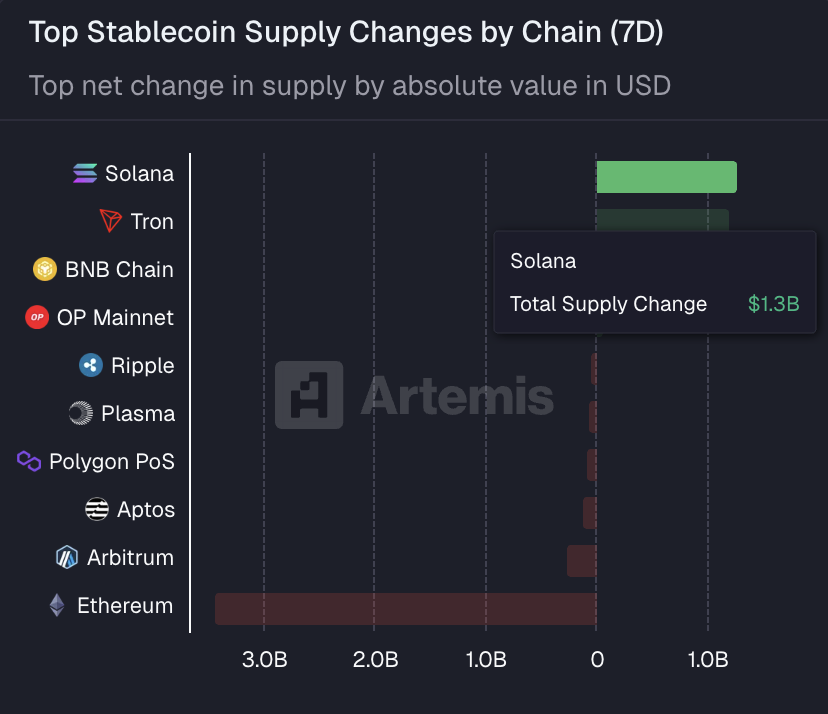
- Solana added $1.3B in stablecoins over 7 days while Ethereum lost $3.4B, per Artemis data.
- SOL's staking ratio hit a record 70%, securing $60 billion, with ETFs recording $10.7M in weekly inflows.
- Technical indicators show SOL at a critical inflection point, with $127.59 as immediate resistance and $117.58 as key support.
Solana has stabilized near the $124 level after recording the largest stablecoin inflows among blockchain networks over the past seven days. According to Artemis data, the network added $1.3 billion in stablecoins while Ethereum experienced a $3.4 billion outflow during the same period.
The SOL token currently trades at $125.66, posting a modest 0.67% gain in the last 24 hours. However, the asset remains down 1.08% over the past week. Total market capitalization now stands at $71.06 billion, with trading volume declining 44.91% in the latest session.
This liquidity migration highlights Solana’s growing appeal amid broader market volatility. The network’s high-speed infrastructure continues to attract capital as investors seek alternatives to Ethereum’s ecosystem.
Solana Staking and ETF Inflows Surge
Solana’s on-chain activity has reached milestone levels across multiple categories. The staking ratio hit a record 70%, securing approximately $60 billion worth of SOL tokens. This figure represents one of the highest staking participation rates among major proof-of-stake networks.
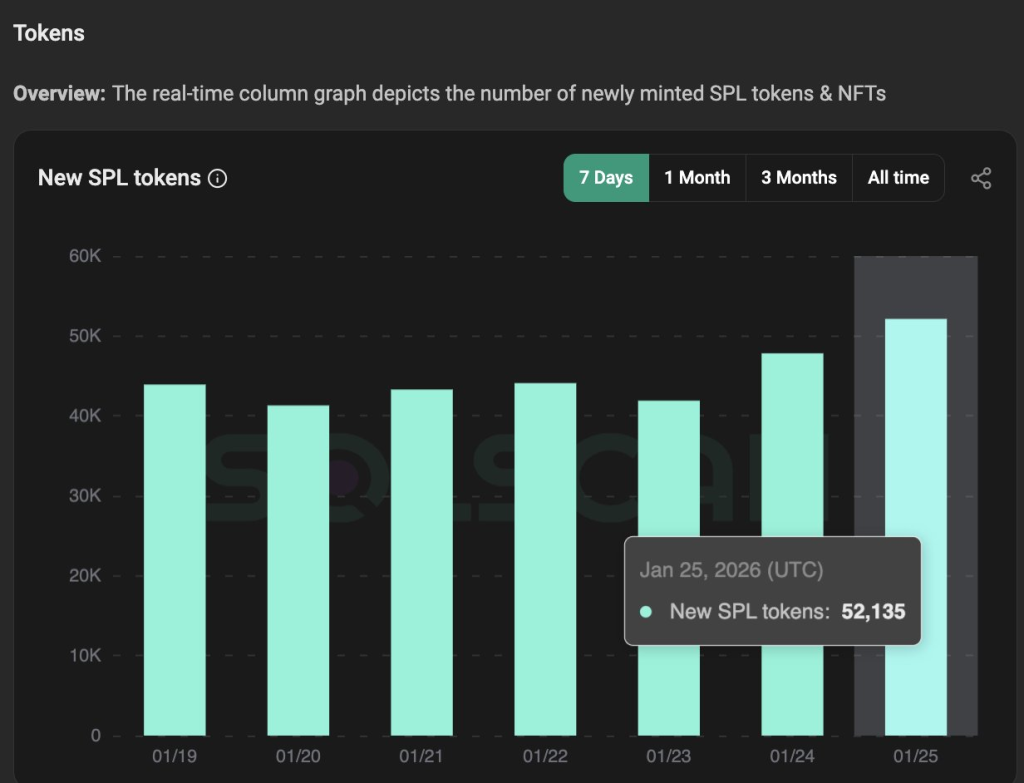
Meanwhile, the network captured top positions in revenue generation and decentralized exchange volume. Over 52,000 new tokens launched on Solana within a 24-hour period, marking the highest level in five months.
Solana-focused exchange-traded funds recorded positive inflows in both daily and weekly measurements. Data shows a one-day net flow of +22,422 SOL, equivalent to $2.78 million. The seven-day net flow reached +86,269 SOL, totaling $10.7 million, with Bitwise ETF leading the inflow race, according to Lookonchain.
In contrast, both Bitcoin and Ethereum ETFs experienced outflows during the same timeframe. This divergence underscores shifting institutional sentiment toward Solana products.
SOL Derivatives and Funding Rates Turn Bullish
Global cryptocurrency perpetuals volume surged 143.8% to $991.6 billion in 24 hours. Solana derivatives contributed approximately 12% of total activity across exchanges.
Funding rates turned positive at +0.0051%, pointing to increased long positioning among traders. Positive funding rates occur when traders pay premiums to maintain bullish leveraged positions.
SOL defended the $122.62 pivot point, a level that has served as support since January 25. This held despite reduced sell pressure, with 24-hour spot volume falling 45.7% to $3.38 billion.
The token’s 24-hour turnover ratio stands at 4.7%, remaining below its 90-day average. This metric suggests muted institutional participation despite the price stabilization.
SOL Lags Traditional Assets Over 12 Months
Over the past 12 months, traditional assets have outperformed cryptocurrency markets significantly. Silver gained 267%, gold rose 84%, and copper increased 38%. U.S. equities posted solid advances, with the Nasdaq up 22% and both the S&P 500 and Russell 2000 climbing 16%.
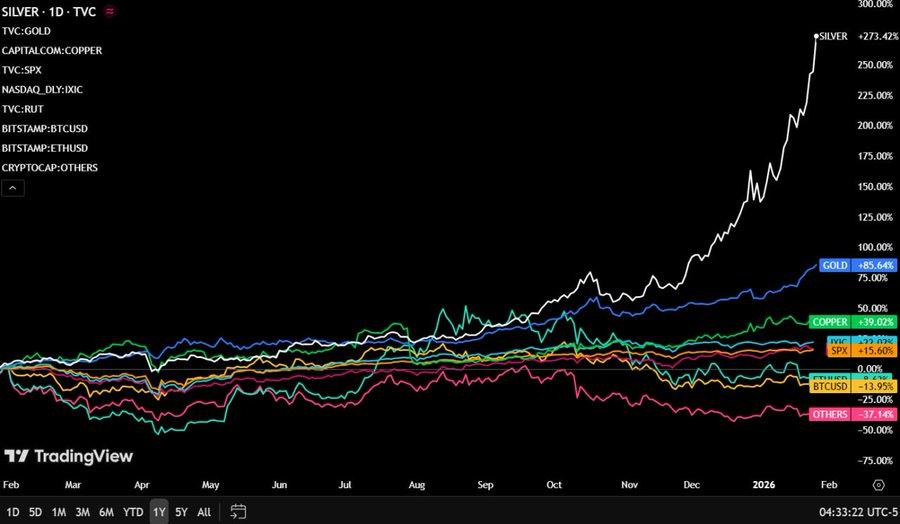
Cryptocurrency performance lagged sharply during this period. Solana declined nearly 45%, Bitcoin fell 14%, and Ethereum dropped 8%.
External factors continue to influence market sentiment. Kalshi data shows 75% odds of a government shutdown by January 31. President Trump recently stated that 100% tariffs would be imposed on Canada if the country makes a deal with China.
SOL Technical Indicators Signal Consolidation
SOL trades at $125.67 on the daily chart, positioned near the lower Bollinger Band at $118.58. The upper band sits at $150.50, with the middle band at $134.54. This positioning near the lower boundary suggests oversold conditions.
The token remains below all major moving averages, confirming a downtrend structure. The nine-period EMA at $127.59 serves as immediate resistance, while the 30-day SMA at $133.42 represents a significant barrier.
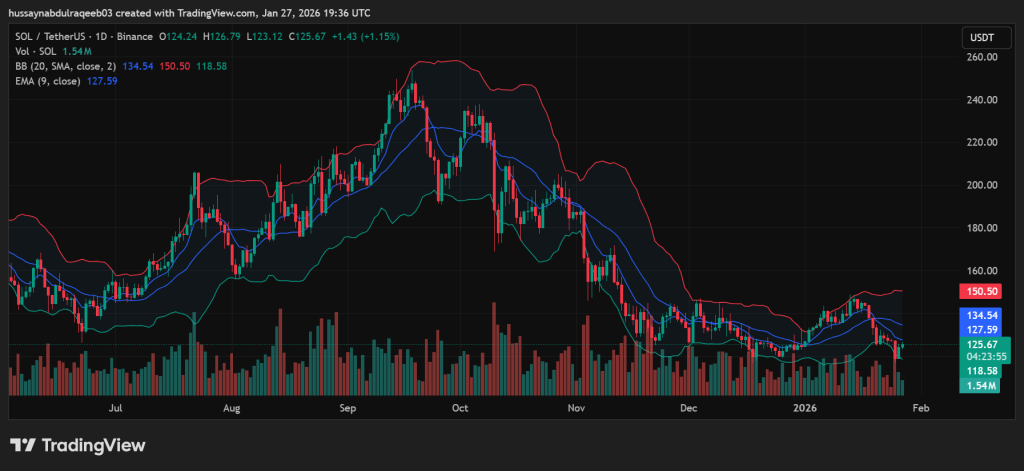
The Relative Strength Index reads 40.88, approaching oversold territory but not yet at extreme levels. The MACD histogram stands at -2.12, bearish but showing improvement from prior readings.
Key support levels include $118.58 at the Bollinger Band lower boundary and $117.58 at the Fibonacci swing low. Resistance zones sit at $127.59, $134.54, and $150.50.
A break above $127.59 with volume could trigger momentum buying toward $134. Failure to clear this level risks retesting $117 support. The price trajectory remains neutral until SOL breaks decisively above the $127-128 zone with sustained volume.
Disclaimer: Coinwaft is a crypto media platform providing cryptocurrency news, analysis, and trading information. The content of this article is for informational purposes only and should not be considered as financial, legal, or investment advice. Readers are advised once again to research or consult a financial expert before making any financial decision.
© 2026 Coinwaft. All Rights Reserved.

Abdul-Raqeeb Hussayn
Abdul-Raqeeb Hussayn
I'm a Web3 content writer with a Web2 marketing background. I create blogs, reports, and market analysis that make complex blockchain concepts clear for readers and credible for investors.
Author profileTrending Today

Solana
SOL
$98.8

Bitcoin
BTC
$76,285.18

Zama
ZAMA
$0.03

Ethereum
ETH
$2,264.16

Sui
SUI
$1.13

TRIA
TRIA
$0.02

River
RIVER
$12.08

Aave
AAVE
$127.24
newsletter
Busy Wealth
Join the Busy Wealth newsletter that helps thousands of investors get early alpha and understand the crypto market.
By pressing the "Subscribe button" you agree with our Privacy Policy.
Crypto Today