 Coinwaft
Bitcoin and Ethereum Eye Fresh Highs as 11% Slide in Open Interest Hints at Market Reversal.
Market deleveraging intensifies as Open Interest plunges 11.32% in seven days, positioning Bitcoin and Ethereum for potential breakouts as historical reversal patterns emerge.
November 11, 2025 at 8:46 PM
Last updated
November 11, 2025 at 8:46 PM

Bitcoin and Ethereum position themselves for potential following recent market deleveraging events that’s saw Open Interest drop 11.32% over the last seven days.
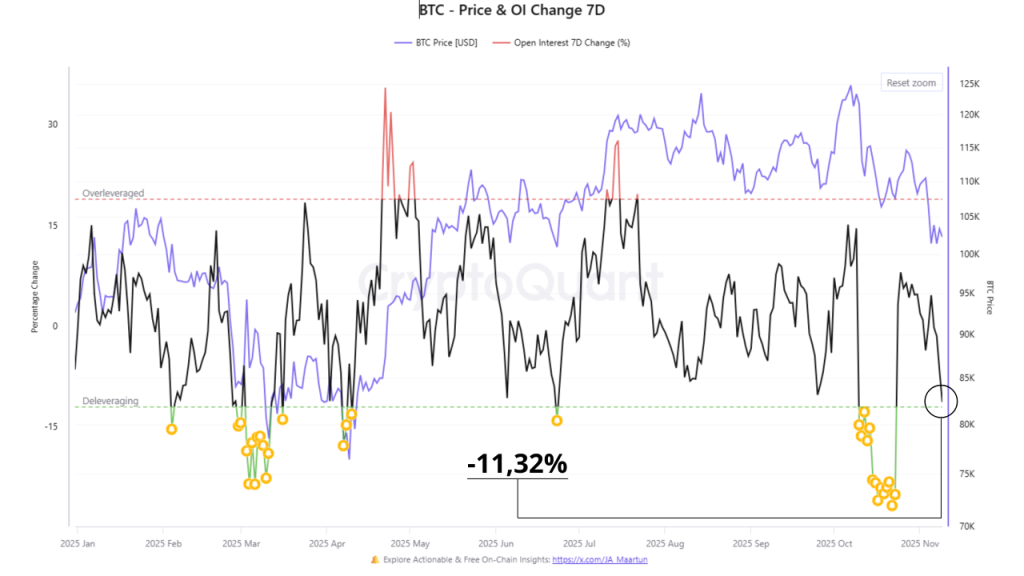
This decline approaches the critical 12% threshold historically associated with strong buying opportunities and market recovery.
The sharp reduction in Open Interest represents a purge of excessive speculative leverage. Market analysts view this deleveraging event as a necessary reset for structural market health, historically preceding significant recoveries.
Deleveraging occurs when traders close leveraged positions across both long and short sides. This process reduces systemic risk and limits potential for further price declines.
Bitcoin Tests Six-Figure Territory Amid Leverage Flush
According to CryptoQuant, Bitcoin experienced Open Interest drops ranging from 8% to 19% during recent deleveraging events. In one extreme case, total Open Interest fell by more than $10 billion.
Glassnode data shows Bitcoin futures open interest remains subdued following October’s leverage flush. Derivatives activity has slowed materially, mirroring broader market sentiment patterns.
Bitcoin briefly touched $107,000 earlier, marking its highest level in recent weeks. The cryptocurrency currently trades at $104,469, reflecting a 1.60% decline over 24 hours but maintaining a 0.72% weekly gain.
CryptoQuant identifies a famous liquidity pattern reappearing, one that has preceded every major Bitcoin surge historically. The pattern centers on the 1D 50SMA and 200SMA death cross formation.
Every death cross occurrence over the past seven years marked at least a local bottom within approximately five days. Each instance preceded rallies of at minimum 45% from the low.
The next death cross formation is expected within five days. JPMorgan indicated Bitcoin has “significant upside” following large leverage cleanups, making the asset more attractive to institutional investors.
Trader Mayne identified a bullish weekly SFP at the 50-week MA at every major low this cycle.
“We’ve have a bullish weekly SFP at the 50 week MA at every major low so far this cycle. $25k, $50k, $75k and now we have put one in at $100k. Will history repeat?” He said
Meanwhile, trader Neko suggested the bounce may be short-lived, as Bitcoin invalidated the 1-hour uptrend line near $106,000, with chart projections indicating a potential test of $104,000 support at the 0.618 Fibonacci level.
Bitcoin Weekly Chart Shows Bull Structure Intact Above $100,000
Weekly chart analysis reveals Bitcoin’s macro structure evolved significantly since the 2022 bottom near $15,000-$17,000. An extended accumulation phase throughout 2023 preceded a parabolic rally from $25,000 to $73,000, representing approximately 200% gains.
Bitcoin currently holds at $105,447 after correcting roughly 20% from all-time highs near $130,000. The pullback brought price closer to the rising moving average around $105,000, now serving as dynamic support.
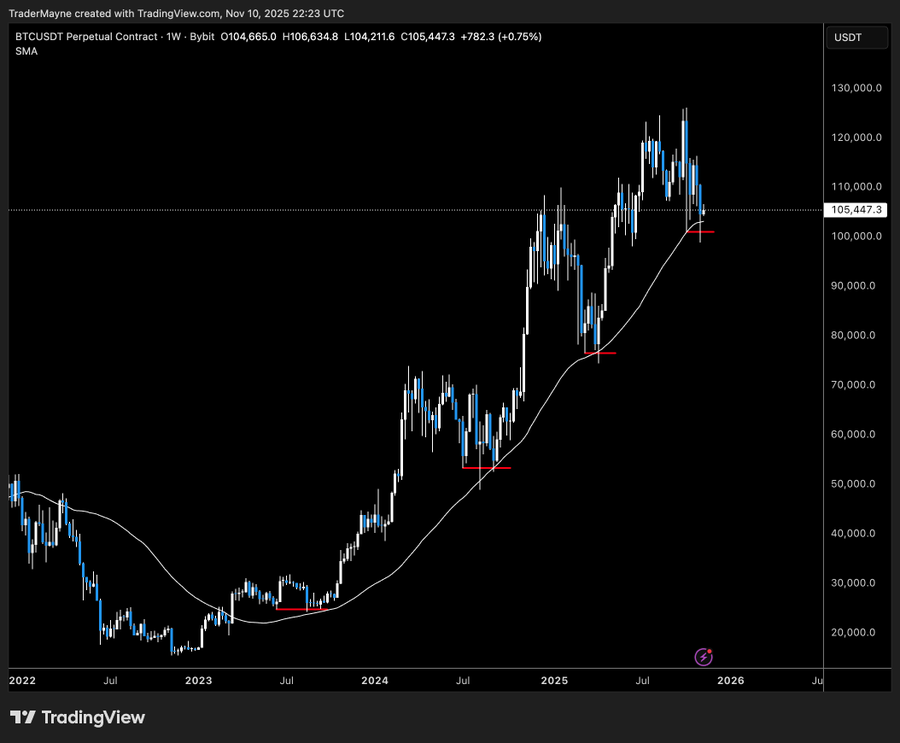
Critical support zones include the $50,000-$60,000 breakout area and the psychological $100,000 level. Resistance establishes near $125,000-$130,000, with potential targets at $150,000 and $175,000-$200,000 if bulls reclaim recent highs.
Weekly candles show increasing volatility with longer wicks, indicating profit-taking at elevated levels. However, the moving average maintains positive slope with price holding above key dynamic support.
Bitcoin maintains bull market structure from 2022 lows. The correction appears corrective rather than impulsive, supporting continuation of the uptrend rather than major reversal. The path of least resistance remains upward provided $100,000 support holds.
Ethereum Supply Dynamics Signal Accumulation Phase
Ethereum rose alongside Bitcoin, with the second-largest cryptocurrency nearly reaching an all-time high after crossing the $3,600 mark. The token currently trades at $3,494, down 1.19% over 24 hours and 1.59% weekly, pushing market capitalization to $421.9 billion.
Binance data shows Ethereum supply on the platform trending downward since mid-year. The largest Ethereum trading platform by volume recorded this clear supply decline pattern.
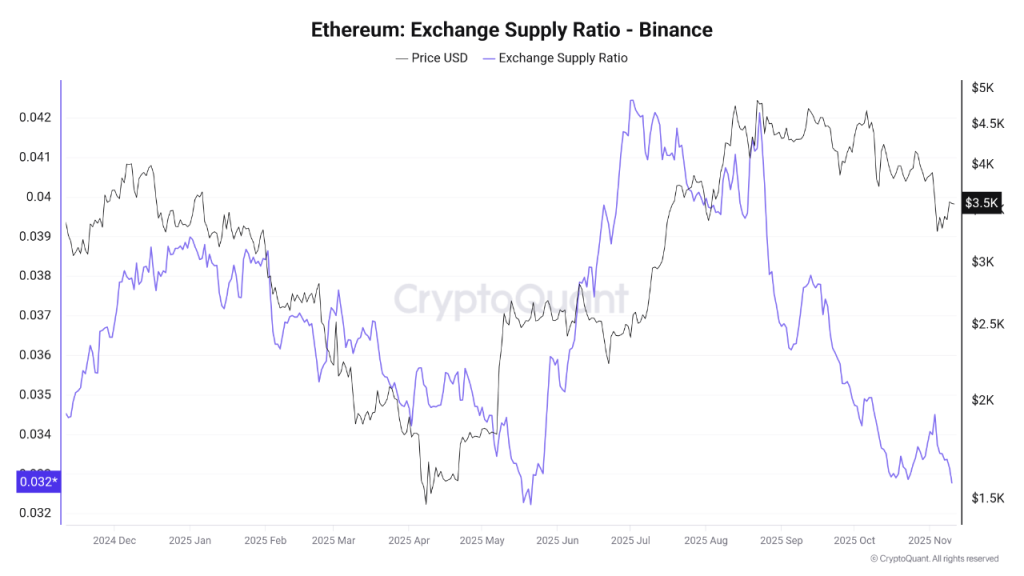
CryptoQuant data reveals Ethereum reached consecutive highs near $4,500-$5,000 during August and September 2025 before retreating to current levels around $3,500. This decline coincided with the sharp supply drop.
The supply reduction suggests traders withdrew coins after profit-taking in preparation for longer-term holdings. Current indicators reflect a transitional phase where investors appear to be accumulating.
Tom Lee, CEO of FundStrat and BitMine, projects Ethereum could reach $9,000-$12,000 by January. He noted stablecoins and tokenized gold have cannibalized Bitcoin demand, with these instruments running on smart contract blockchains like Ethereum.
A whale purchased $269.46 million in ETH recently, making it over $450M worth of ETH in the past month, signaling growing institutional interest. Market participants report ETH upside liquidity continues rising, with one additional green candle potentially favoring bulls.
The weekly SRSI indicator approaches another cross. The last completed weekly SRSI cross saw Ethereum rally from $1,300 to $4,965, suggesting momentum favors upside over the next three months.
Ethereum Daily Chart Shows Relief Rally Testing Key Resistance Near $3,580
The Ethereum (ETH/USD) daily chart shows the asset attempting a recovery after a sharp selloff. Price recently rebounded from strong support around the $3,350–$3,500 zone, where the 200-day moving average provided a solid base. The current move upward, however, is meeting resistance near $3,580, which aligns closely with the lower boundary of the previous consolidation box highlighted on the chart.
Multiple moving averages (especially the 50-, 100-, and 200-day EMAs) are still stacked above the current price and trending downward, reflecting ongoing bearish pressure.
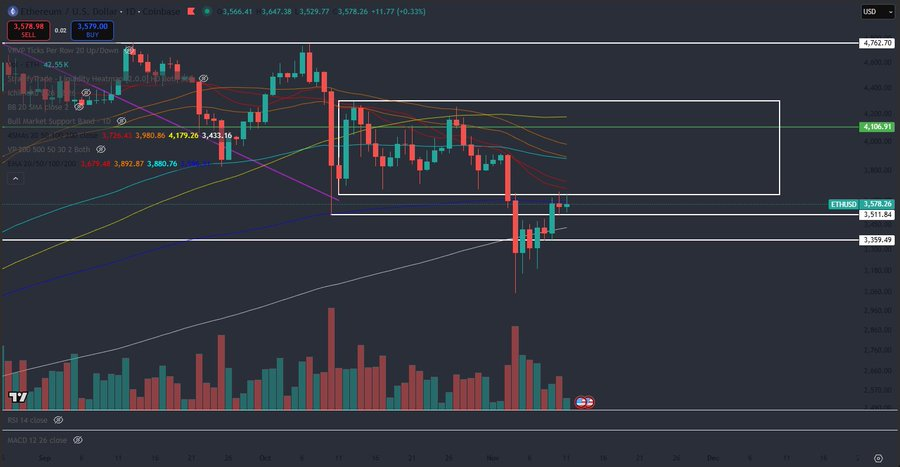
The large rectangle between roughly $3,500 and $4,100 marks a key consolidation range; reclaiming and holding above $3,800–$3,900 would be the first sign of a potential bullish reversal.
For now, ETH appears to be in a relief rally within a broader downtrend. Unless it can break decisively above $3,800 and sustain momentum toward $4,100, the probability leans toward a rejection and another leg down, possibly retesting the $3,350 support area. Momentum indicators like MACD and RSI show mild recovery, suggesting short-term buying interest, but the overall market structure remains bearish until resistance is flipped into support.
Disclaimer: Coinwaft is a crypto media platform providing cryptocurrency news, analysis, and trading information. The content of this article is for informational purposes only and should not be considered as financial, legal, or investment advice. Readers are advised once again to research or consult a financial expert before making any financial decision.
© 2026 Coinwaft. All Rights Reserved.

Abdul-Raqeeb Hussayn
Abdul-Raqeeb Hussayn
I'm a Web3 content writer with a Web2 marketing background. I create blogs, reports, and market analysis that make complex blockchain concepts clear for readers and credible for investors.
Author profileTrending Today
Seeker
SKR
$0.02

Bitcoin
BTC
$89,810.45
ETHGas
GWEI
$0.03

River
RIVER
$46.47

Pudgy Penguins
PENGU
$0.01

XRP
XRP
$1.96

Lighter
LIT
$1.75

Solana
SOL
$130.15
newsletter
Busy Wealth
Join the Busy Wealth newsletter that helps thousands of investors get early alpha and understand the crypto market.
By pressing the "Subscribe button" you agree with our Privacy Policy.
Crypto Today