 Coinwaft
Bitcoin Climbs Back Above $65K as Market Enters Loss-Realization Regime — Relief Rally Ahead?
On-chain data signals loss-realization phase as ETF outflows hit $497 million weekly and technical indicators point to key resistance at $68K
9 hours ago
Last updated
9 hours ago

KEY FACTS
- Bitcoin reclaims $65K after dropping to $62K, posting 3.35% daily gains but remaining 25% below last month's levels
- On-chain Realized Profit/Loss Ratio falls below 1, signaling a loss-realization regime that historically lasts 6+ months
- ETF outflows reach $497M weekly while technical resistance at $68K determines short-term price direction
Bitcoin reclaimed the $65,000 level after a sharp decline to approximately $62,000 earlier this week. The flagship cryptocurrency now trades at $65,401.69, marking a 3.35% increase over the past 24 hours. However, BTC remains down 3.83% on the weekly chart and 25.56% lower than its $88,000-$89,000 close last month.
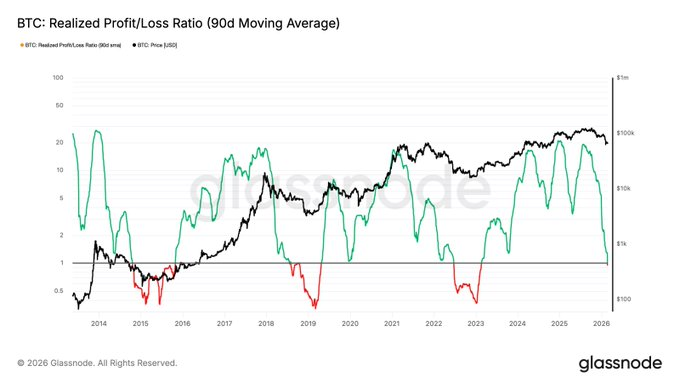
The market capitalization has recovered to $1.3 trillion, reflecting a 3.29% daily gain. Meanwhile, on-chain metrics signal the market has entered a loss-realization regime. The Realized Profit/Loss Ratio (90-day SMA) has fallen below 1, a historically significant threshold.
This metric indicates that more value is currently being realized in losses than profits across the network. Historical data shows breaks below this level have persisted for six months or longer in previous cycles.
Bitcoin ETF Outflows and Long-Term Holder Stress
Bitcoin ETFs continue to face significant selling pressure amid the broader market downturn. According to Lookonchain, one-day net flows stand at negative 3,262 BTC, equivalent to approximately $205.37 million in outflows.
The seven-day picture appears even more concerning, with net outflows reaching 7,895 BTC, or roughly $497.07 million. These figures underscore institutional hesitation at current price levels.
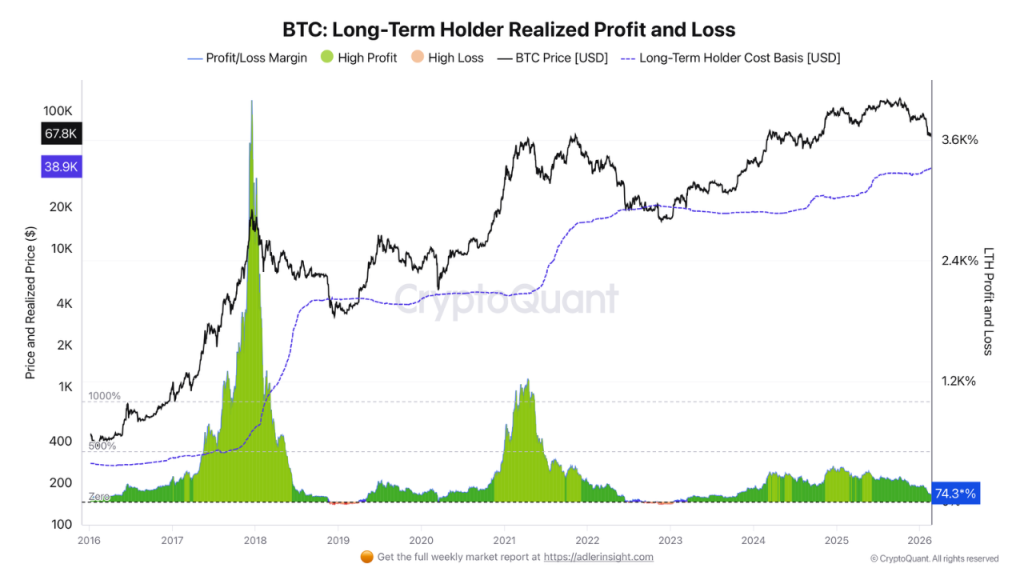
Long-term holders currently sit on an average profit of approximately 74%. This profit margin continues to shrink as price approaches the LTH cost basis, estimated around $38,900. The cost basis rises over time as short-term holders transition into long-term holder status.
Historical bear markets have featured price breaking below this cost basis, triggering final capitulation phases. These periods have typically seen realized losses of around 20% before trend reversals materialized.
The current cycle differs from previous ones with institutional participants, corporate entities, and sovereign actors now involved. These structural changes may alter traditional market dynamics.
Futures Market Signals and Global Liquidity
Funding rates remain in negative territory at the current Bitcoin range between $62,000 and $68,000. This contrasts with the previous bottom around $80,000, where funding rates stayed predominantly positive.
Since July 2025, selling has dominated market activity, with buy limit orders primarily absorbing supply. Current selling pressure sits at its highest level in three months. The futures market has maintained high leverage for 16 months.
Since Bitcoin’s last all-time high, excessive leverage has been declining. Price declines force capitulation, which impacts leverage health positively for long-term market structure.
Meanwhile, money supply across major economies sits at all-time highs. The United States, China, Japan, and European Union continue expanding liquidity. BTC trades roughly 45-47% below its all-time high despite this macro expansion.
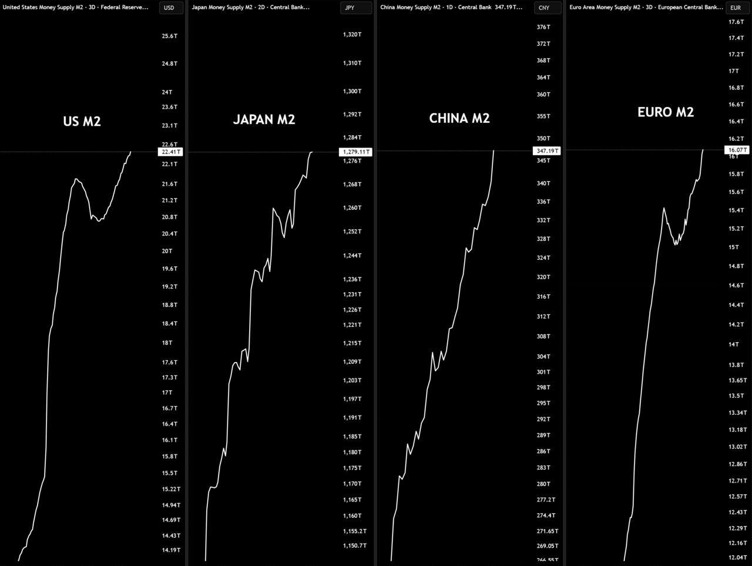
Historical divergences between global liquidity and Bitcoin price have typically resolved with capital flowing into risk assets. Fresh liquidity has not meaningfully entered the crypto market recently.
Bitcoin Technical Indicators and Key Support Levels
The daily chart reveals a confirmed bearish structure with lower highs from $120,000 to $100,000 to $90,000. Price currently attempts to stabilize around $64,000-$66,000 following capitulation-style selling.
Immediate support sits at $64,000-$64,300, coinciding with the lower Bollinger Band. Major support at $60,000-$61,000 represents a psychological round number and previous consolidation zone.
Resistance at $67,800-$68,500 aligns with the 20-day SMA and middle Bollinger Band. This level determines near-term direction. Secondary resistance at $71,400-$72,000 marks the recent breakdown level.
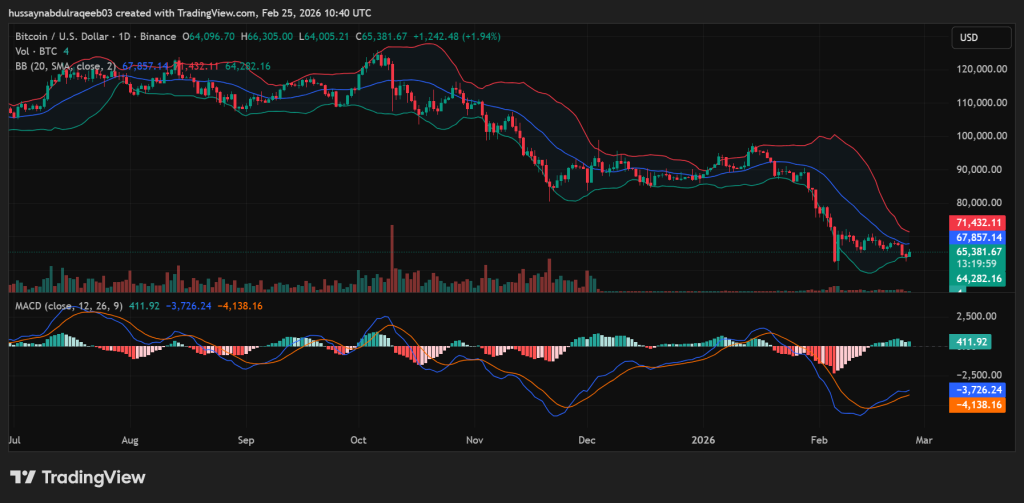
The MACD shows early signs of improvement with the histogram turning green at 411.92. The MACD line reads -3,726.24 against the signal line at -4,138.16. Both lines remain deep in bearish territory.
Volume analysis reveals significantly lighter participation on the current bounce compared to the capitulation selloff. Low volume bounces typically indicate weak conviction rather than genuine accumulation.
A daily close above $67,857 would confirm mean reversion toward the upper band at $71,432. Rejection at the middle band increases probability of retesting $60,000. The short-term outlook remains neutral to bearish until $68,000 reclaims with volume confirmation.
Disclaimer: Coinwaft is a crypto media platform providing cryptocurrency news, analysis, and trading information. The content of this article is for informational purposes only and should not be considered as financial, legal, or investment advice. Readers are advised once again to research or consult a financial expert before making any financial decision.
© 2026 Coinwaft. All Rights Reserved.

Abdul-Raqeeb Hussayn
Abdul-Raqeeb Hussayn
I'm a Web3 content writer with a Web2 marketing background. I create blogs, reports, and market analysis that make complex blockchain concepts clear for readers and credible for investors.
Author profileTrending Today

Bitcoin
BTC
$68,916.35

Polkadot
DOT
$1.72

Pudgy Penguins
PENGU
$0.01

Solana
SOL
$90.26

Ethereum
ETH
$2,106.89

Sui
SUI
$1.01

Virtuals Protocol
VIRTUAL
$0.71

Canton
CC
$0.17
newsletter
Busy Wealth
Join the Busy Wealth newsletter that helps thousands of investors get early alpha and understand the crypto market.
By pressing the "Subscribe button" you agree with our Privacy Policy.
Crypto Today