 Coinwaft
Ethereum Slides to $1.9K as It Records Six Straight Monthly Losses for the Second Time Ever
Historic six-month losing streak mirrors 2018 capitulation as ETF outflows exceed $126 million and price tests critical support
9 hours ago
Last updated
9 hours ago

KEY FACTS
- Ethereum drops to $1,912 marking sixth consecutive month of losses—only second time in history after 2018 bear market
- ETF outflows reach $126.52 million weekly while 30% of ETH supply remains staked with more awaiting activation
- Technical indicators show weakening selling pressure but bearish trajectory remains until price closes above $2,001
Ethereum has dropped to $1,912.60, recording a 1.83% decline in 24 hours and a 2.91% loss over the past week. The asset’s market capitalization now sits at approximately $230.14 billion following a 2.03% daily decline.
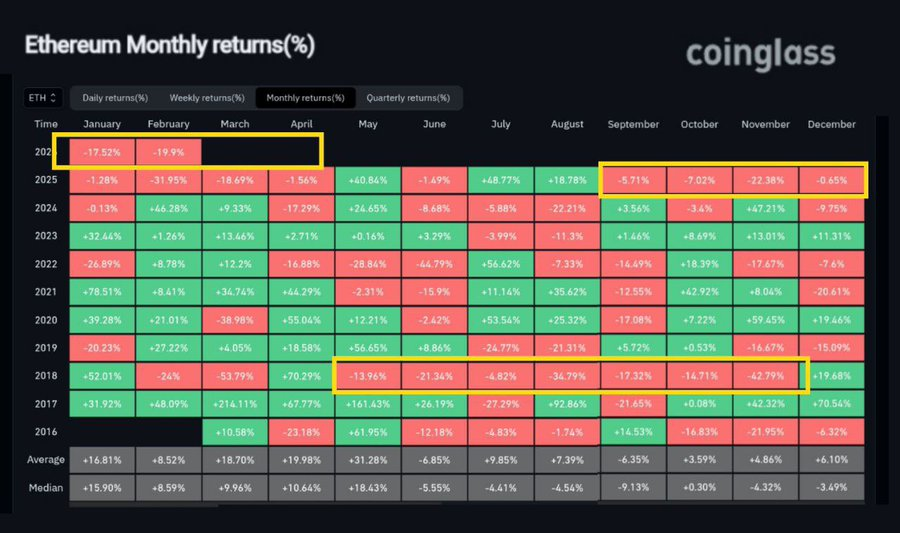
This price action marks the sixth consecutive month of negative returns for the second-largest cryptocurrency. The last time Ethereum experienced such a prolonged losing streak was in 2018, when seven straight red months occurred during the bear market peak.
That 2018 period represented the final capitulation phase before a major trend reversal began. The current streak has drawn comparisons to that historical pattern among market observers.
Meanwhile, the broader cryptocurrency market has shed over $2.22 trillion from its peak. Overall crypto valuations have fallen more than 50% from all-time highs. Ethereum’s current selloff ranks as the second-largest dollar drawdown in its history.
ETH ETF Outflows and Institutional Activity Paint Mixed Picture
Data from Lookonchain reveals significant outflows from Ethereum exchange-traded funds. Daily net flows registered negative 57,543 ETH, equivalent to approximately $110.83 million leaving the products.
Weekly outflows totaled 65,691 ETH, representing $126.52 million in redemptions. These figures underscore ongoing weakness in institutional demand for spot Ethereum exposure through regulated vehicles.
On the staking front, 30% of all ETH supply remains locked, with 37 million ETH currently staked. An additional 3.7 million ETH awaits staking activation, with a projected wait time of 64 days.
Once fully processed, one-third of Ethereum’s total supply will be locked. This milestone carries psychological significance for market participants tracking supply dynamics.
BlackRock recently deposited 7,553 ETH worth approximately $14.46 million to Coinbase. The asset manager also moved 1,134 BTC valued at roughly $75 million to the exchange.
Tom Lee’s Fundstrat-affiliated Bitmine purchased an additional 51,162 ETH last week, valued at $98.33 million. The firm now holds 4,422,659 ETH worth approximately $8.5 billion at current prices.
Bitmine’s average cost basis stands at $3,821 per ETH. The position is currently underwater by nearly $8.4 billion based on current market valuations.
In contrast, Ethereum co-founder Vitalik Buterin sold 1,869 ETH worth $3.67 million over two days. This followed a withdrawal of 3,500 ETH from the Aave lending protocol. Total sales since February 2 have exceeded 8,000 ETH.
Macroeconomic Catalysts Set to Drive ETH Volatility This Week
Several macroeconomic catalysts are scheduled throughout the week. President Trump’s 15% global tariffs took effect Monday, already rattling financial markets.
Tuesday brings February consumer confidence data. NVIDIA’s earnings announcement follows on Wednesday, closely watched for AI sector sentiment signals.
Initial jobless claims data arrives Thursday, followed by January PPI inflation figures on Friday. These releases could drive additional volatility across risk assets including cryptocurrencies.
ETH Price Faces Critical Support Levels Amid Bearish Momentum
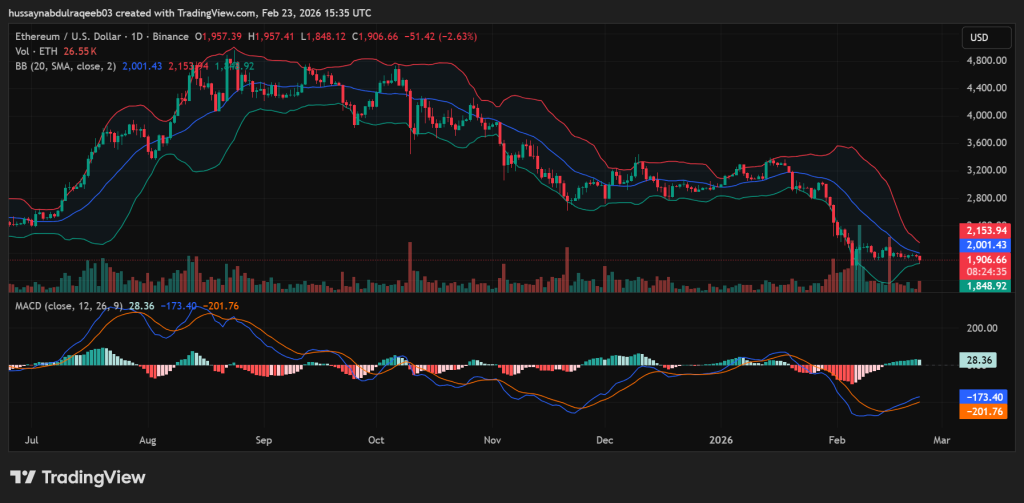
Ethereum trades at $1,906.66, hugging the lower Bollinger Band at approximately $1,848.92. The middle band sits at $2,001.43, serving as immediate resistance. The upper band extends to $2,153.94.
MACD readings show the signal line at -173.40 crossing above the histogram at -201.76. The histogram has turned green at 28.36, suggesting selling pressure is weakening.
Analyst Ted Pillows noted current price action mirrors the Q4 2025 fractal pattern. Also, Sykodelic identified a hidden bullish divergence on the weekly chart, with RSI forming a lower low while price established a higher low.
Critical support sits at the $1,850 to $1,800 zone. A break below this level opens the path toward $1,600. Major resistance clusters between $2,000 and $2,150, where multiple rejections are expected.
Volume during the recent bounce remains light compared to selloff spikes. Green candles on declining volume suggest short covering rather than genuine accumulation. For trend reversal confirmation, sustained expanding volume on consecutive up days is required.
The bearish scenario carries 60% probability based on current technical structure. Price trajectory remains bearish until a daily close above the $2,001 middle Bollinger Band occurs.
Disclaimer: Coinwaft is a crypto media platform providing cryptocurrency news, analysis, and trading information. The content of this article is for informational purposes only and should not be considered as financial, legal, or investment advice. Readers are advised once again to research or consult a financial expert before making any financial decision.
© 2026 Coinwaft. All Rights Reserved.

Abdul-Raqeeb Hussayn
Abdul-Raqeeb Hussayn
I'm a Web3 content writer with a Web2 marketing background. I create blogs, reports, and market analysis that make complex blockchain concepts clear for readers and credible for investors.
Author profileTrending Today

Bitcoin
BTC
$64,030.17

Pudgy Penguins
PENGU
$0.01

Espresso
ESP
$0.18

Flying Tulip
FT
$0.1

Solana
SOL
$78.48
pippin
PIPPIN
$0.8

Enso
ENSO
$2.69

Ethereum
ETH
$1,853.68
newsletter
Busy Wealth
Join the Busy Wealth newsletter that helps thousands of investors get early alpha and understand the crypto market.
By pressing the "Subscribe button" you agree with our Privacy Policy.
Crypto Today