 Coinwaft
Bitcoin Slides Below $76K — CryptoQuant Analyst Says On-Chain Data Shows No Meaningful Reversal Ahead
ETF demand collapse, zero Bull Score reading, and bearish technical structure reinforce downside risk toward $70K
3 hours ago
Last updated
3 hours ago

KEY FACTS
- Bitcoin remains firmly in a bear market, with CryptoQuant’s Bull Score Index at zero and on-chain data showing no signs of a meaningful trend reversal.
- Spot demand and ETF flows have flipped decisively bearish, creating a 56,000 BTC demand gap while liquidity and stablecoin growth continue to stall.
- Technical structure favors further downside, with BTC walking the lower Bollinger Band and a breakdown below $74K opening the path toward the $70K–$72K zone.
Bitcoin has fallen below $76,000 after failing to hold gains from a brief recovery attempt. The leading cryptocurrency dropped to $74,000 over the weekend before bouncing to approximately $79,000, only to lose momentum once again.
CryptoQuant’s Head of Research Julio Moreno has confirmed, in a podcast with LG Doucet of Milk Road, that the market remains in bearish territory and on-chain metrics point to continued weakness with no meaningful reversal on the horizon.
The asset currently trades at $77,789.17, marking a 4.02% decline over 24 hours. Weekly losses have reached a significant 13.42%, erasing recent gains accumulated during earlier sessions.
According to Lookonchain, Bitcoin ETFs recorded a net inflow of 5,955 BTC worth $464.49 million in the daily timeframe. However, the seven-day picture remains negative with outflows totaling 11,571 BTC, equivalent to $902.54 million.
Bitcoin’s Bull Score Index Signals Deep Bear Market Territory
Moreno revealed that Bitcoin’s Bull Score Index currently sits at zero, the lowest possible reading. This metric has remained between 0 and 10 for the past several months.
The index stood at 80 when Bitcoin reached its all-time high. Following the October 10 liquidation event, the score dropped to around 20 and has not recovered since then.
Moreno noted that the Bull Score Index typically switches to bearish before major price corrections occur. The current reading represents one of the weakest signals recorded during this market cycle.
When asked about potential sharp reversals similar to past events, Moreno acknowledged the possibility. However, he emphasized that any recovery would require an extremely large catalyst to materialize.
The analyst compared current conditions to the May 2025 Trump Tariffs period. That earlier correction occurred within a bull market context, unlike the present bear market environment.
ETF Demand Gap Reaches 56,000 BTC
US spot ETF demand has declined significantly compared to the same period last year. Since Q4, ETFs have transitioned from net buyers to net sellers, putting downward pressure on prices.
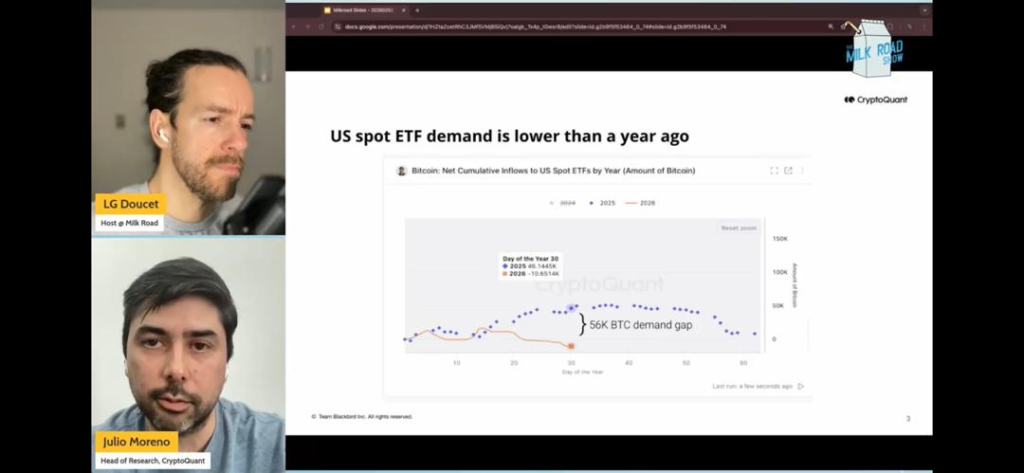
During this time last year, ETFs had purchased over 46,000 BTC. This year, the same ETFs have sold more than 10,000 BTC, creating a demand gap exceeding 56,000 BTC.
The Coinbase Premium Index currently reads negative, according to Moreno’s analysis. This metric suggests US demand remains weaker than demand from international markets.
Stablecoin liquidity growth has also stalled, removing another potential catalyst for price appreciation. Overall long-term demand growth for Bitcoin sits at historically low levels.
Another CryptoQuant analyst reported that spot demand continues drying up as Bitcoin enters its fifth month of correction. The October 10th event triggered massive liquidity destruction in futures markets.
Open Interest collapsed by more than 70,000 BTC in a single day, wiping out over $8 billion. Stablecoin market cap has declined by approximately $10 billion during this period.
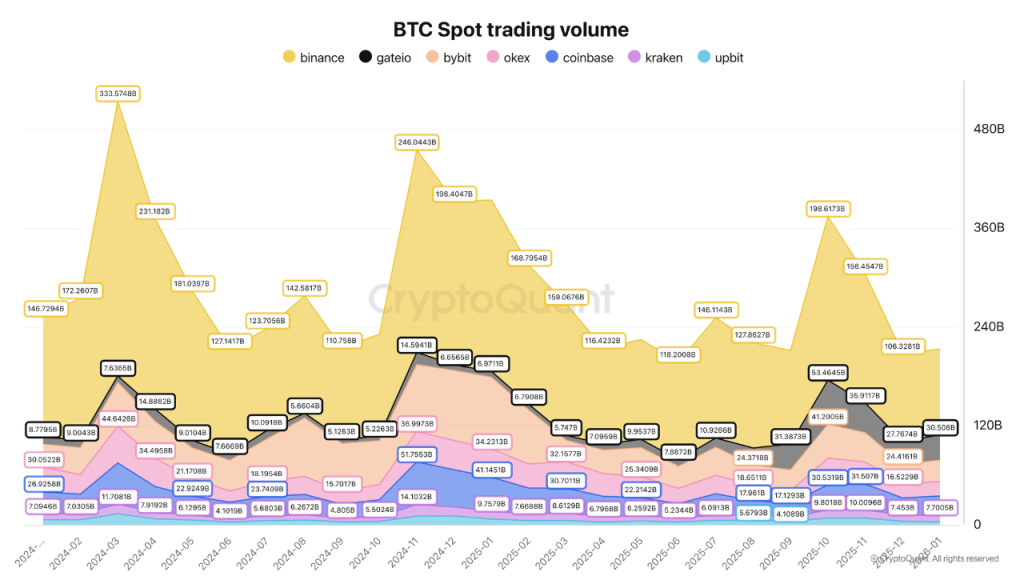
BTC spot volumes have been cut in half since October. Binance maintains the largest share at $104 billion, down from nearly $200 billion recorded in October.
BTC Chart Shows Bearish Structure and Key Support Levels
Bitcoin’s daily chart displays a firmly bearish market structure with consistent lower highs and lower lows. The price trades significantly below all key moving averages, confirming dominant downward momentum.
The 20-day SMA sits at $87,433.16, functioning as dynamic resistance approximately 15% above current price. Bollinger Bands have expanded dramatically, with the lower band at $75,250 currently under test.
Price action shows a classic “band walk” pattern along the lower Bollinger Band. This formation typically signals trend continuation rather than imminent reversal in strong downtrends.
Critical support exists at the $74,000-$75,250 zone, currently under active pressure. A breakdown targets the $70,000-$72,000 range, representing a potential 5-8% additional decline.
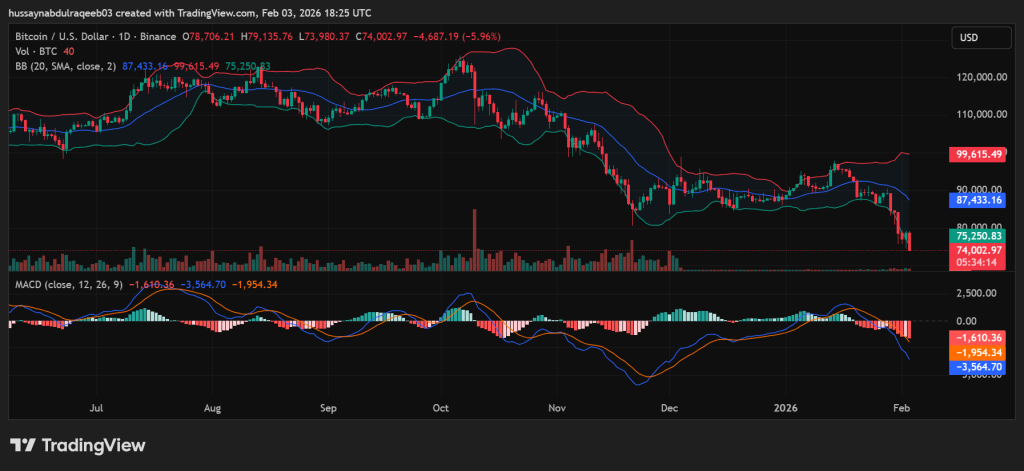
The MACD indicator reads deeply negative with the MACD line at -1,610.36 and signal line at -1,954.34. The expanding histogram confirms accelerating bearish momentum with no divergence present.
Volume analysis reveals elevated distribution during the breakdown below $80,000 with weak buying on recovery attempts. No capitulation volume spike has appeared yet.
Fibonacci analysis places Bitcoin near the 0.786 retracement level around $73,000. Sustained trading below the 0.618 golden ratio historically signals trend reversal rather than correction.
Resistance levels stand at $80,000-$82,000 for any relief rally attempt and $87,000-$90,000 for potential trend change confirmation. The bearish trajectory remains intact with downside targets toward $70,000.
Disclaimer: Coinwaft is a crypto media platform providing cryptocurrency news, analysis, and trading information. The content of this article is for informational purposes only and should not be considered as financial, legal, or investment advice. Readers are advised once again to research or consult a financial expert before making any financial decision.
© 2026 Coinwaft. All Rights Reserved.

Abdul-Raqeeb Hussayn
Abdul-Raqeeb Hussayn
I'm a Web3 content writer with a Web2 marketing background. I create blogs, reports, and market analysis that make complex blockchain concepts clear for readers and credible for investors.
Author profileTrending Today

Bitcoin
BTC
$73,873.29

Solana
SOL
$92.25

Hyperliquid
HYPE
$34.73

Ethereum
ETH
$2,127.95

Pudgy Penguins
PENGU
$0.01

Zama
ZAMA
$0.03

TRIA
TRIA
$0.02

PAX Gold
PAXG
$4,924.25
newsletter
Busy Wealth
Join the Busy Wealth newsletter that helps thousands of investors get early alpha and understand the crypto market.
By pressing the "Subscribe button" you agree with our Privacy Policy.
Crypto Today