 Coinwaft
Solana Crashes Below $100 and Risks Dropping to Two-Year Support Level at $80
SOL sheds 21% in one week as technical indicators point to accelerating bearish momentum and potential test of 2023 support levels
3 hours ago
Last updated
3 hours ago

KEY FACTS
- Solana drops below $100 for the first time in months, losing 21% in one week and over $16 billion in market cap
- Technical indicators show SOL walking the lower Bollinger Band with MACD confirming accelerating bearish momentum
- Critical support at $85-$90 could determine whether SOL tests two-year lows near $80
Solana has plunged below the critical $100 mark for the first time in months, trading at $99.05 after shedding 4.63% in 24 hours. The weekly decline stands at 21.21%, erasing over $16 billion from its market capitalization. SOL now faces the prospect of testing support levels not seen since 2023.
The broader crypto market experienced significant turbulence over the weekend. Bitcoin dropped 7% within 24 hours, briefly touching $79,000 before recovering. Ethereum declined over 13%, reclaiming the $2,300 level after the selloff.
Bitcoin lost more than $265 billion in market cap during the downturn. Ethereum shed approximately $91 billion. Solana’s total market capitalization now sits at $56.09 billion.
A sharp selloff in U.S. tech stocks combined with heightened geopolitical uncertainty triggered a risk-off wave across crypto markets. Bitcoin fell to around $75,000 at its lowest point, sparking over $266 million in leveraged liquidations network-wide.
ETF Flows and Institutional Activity
Solana ETFs recorded a substantial net outflow of 46,453 SOL, equivalent to $4.78 million, in the daily timeframe. However, the seven-day period showed net inflows of 8,069 SOL worth approximately $831,000.
Bitcoin ETFs displayed modest positive movement during the same period. The divergence between short-term outflows and weekly inflows creates mixed signals for institutional sentiment toward Solana.
Market participants on social media platform X expressed divided opinions on the selloff. Bears projected potential drops to $70 or even $50. Bulls, including Phantom co-founder Rushi Manche, encouraged buying the dip.
One trader joked about running out of fiat after purchasing SOL at $100. Optimists pointed to strong fundamentals supporting the network despite price weakness.
Solana’s Network Fundamentals Remain Robust
Solana’s on-chain metrics present a contrasting picture to its price action. The network recently processed a record 150 million daily transactions. Bridged assets totaled $383 million, indicating continued developer and user activity.
Positive SOL ETF inflows of 76,944 tokens over certain periods suggest some institutional accumulation. The $56 billion market cap network continues attracting capital despite facing broader ETF outflow pressures.
Crypto markets remain tightly correlated with traditional risk assets during periods of uncertainty. Capital rapidly exits speculative altcoins when investors flee tech stocks and seek safety.
SOL’s high retail and leveraged trading presence makes it more susceptible to liquidations during market stress. The current environment disproportionately impacts higher-beta assets like Solana.
Technical Analysis
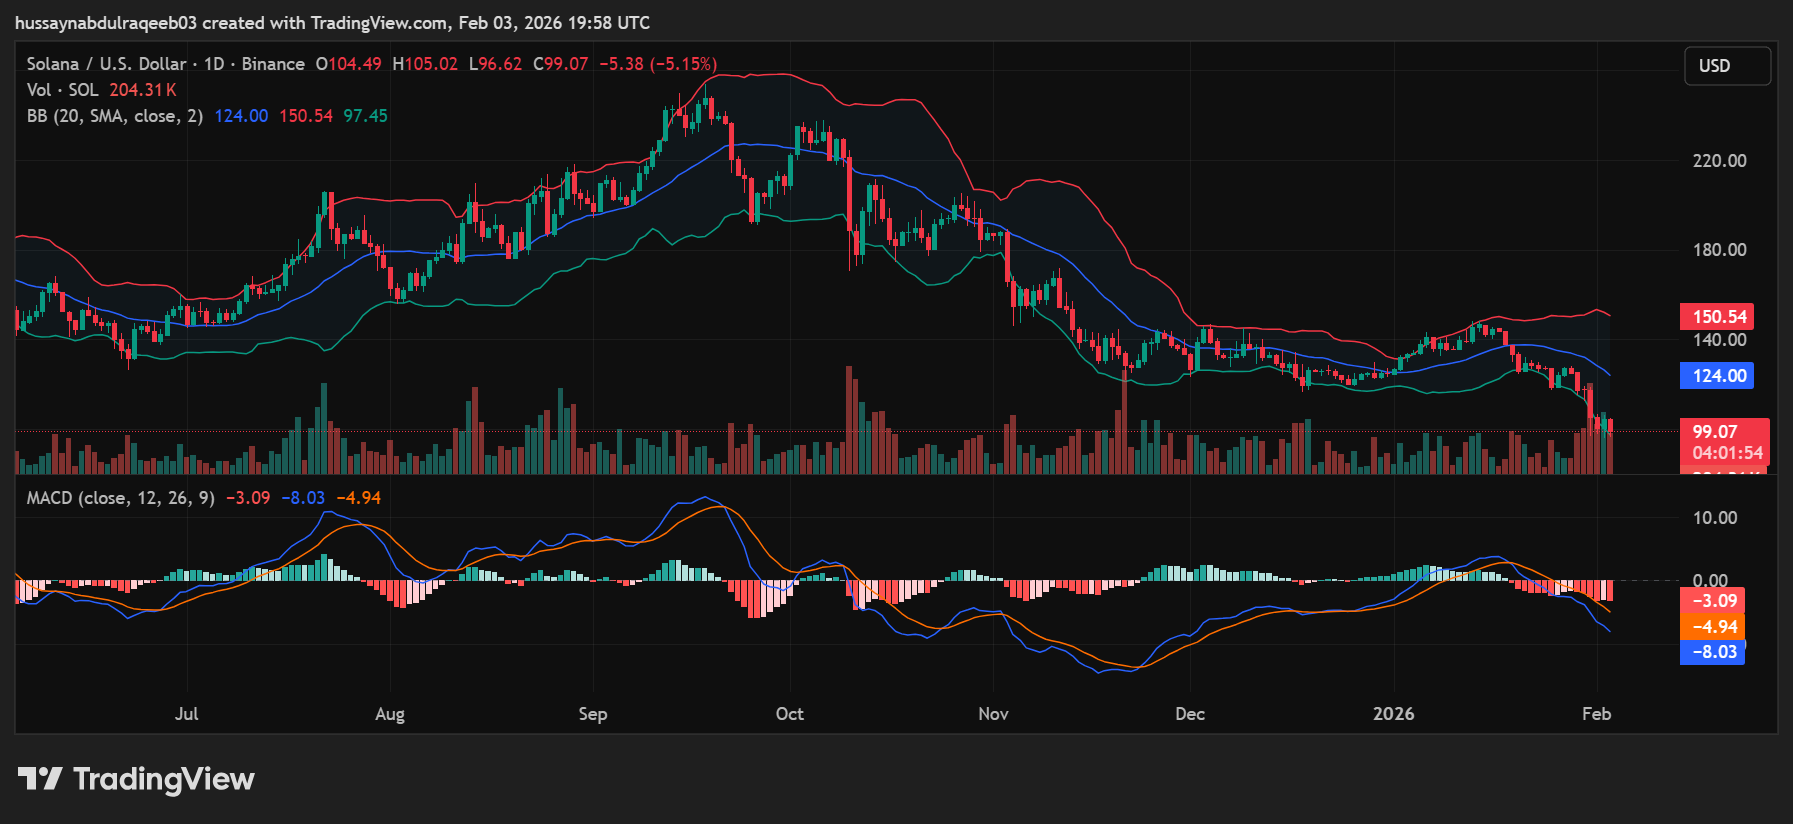
SOL broke below its recent swing low of $96.43, with the 14-day RSI reading 30.68. This indicates oversold conditions without clear reversal signals. The MACD histogram at -2.97 shows bearish momentum continues accelerating.
The Bollinger Bands reveal price is “walking” the lower band near $97.45. The middle band at $124 has flipped from support to strong resistance. Band expansion confirms high volatility with no compression yet visible.
Key support zones emerge at $97-$100, $85-$90, and $75-$80. The $85-$90 range represents the most critical level, marking historical demand from 2024. A break below this zone would push SOL to multi-year lows.
Fibonacci analysis shows SOL trading below the 0.618 retracement level. The 0.786 retracement at $90-$95 represents the next major target. A full retracement to $75-$80 remains possible if selling pressure continues.
Volume analysis reveals increased selling on down days with declining volume on bounce attempts. No exhaustion spikes have occurred yet. Stabilization requires Bitcoin holding above $74,600 and major equity indices finding support.
The bearish scenario carries 65% probability with targets at $90-$92 short-term and $85-$88 medium-term. Reclaiming $124 with volume would invalidate the bearish thesis. Current trajectory points decisively downward until buyers reclaim higher support levels.
Disclaimer: Coinwaft is a crypto media platform providing cryptocurrency news, analysis, and trading information. The content of this article is for informational purposes only and should not be considered as financial, legal, or investment advice. Readers are advised once again to research or consult a financial expert before making any financial decision.
© 2026 Coinwaft. All Rights Reserved.

Abdul-Raqeeb Hussayn
Abdul-Raqeeb Hussayn
I'm a Web3 content writer with a Web2 marketing background. I create blogs, reports, and market analysis that make complex blockchain concepts clear for readers and credible for investors.
Author profileTrending Today

Bitcoin
BTC
$73,873.29

Solana
SOL
$92.25

Hyperliquid
HYPE
$34.73

Ethereum
ETH
$2,127.95

Pudgy Penguins
PENGU
$0.01

Zama
ZAMA
$0.03

TRIA
TRIA
$0.02

PAX Gold
PAXG
$4,924.25
newsletter
Busy Wealth
Join the Busy Wealth newsletter that helps thousands of investors get early alpha and understand the crypto market.
By pressing the "Subscribe button" you agree with our Privacy Policy.
Crypto Today