 Coinwaft
Ethereum Reclaims $3,300 as Network Activity Hits Record High — Is $3,600 Next?
Record wallet creation and $181M in ETF inflows drive Ethereum's breakout as technical indicators turn bullish
6 days ago
Last updated
6 days ago

KEY FACTS
- Ethereum surged 5.1% to $3,377, breaking above $3,300 resistance as the network added a record 393,000 new wallets in a single day.
- ETF daily inflows reached $181.51 million while futures open interest on Binance hit $8.6 billion, the highest since October 2025.
- Technical indicators show a completed triangle breakout with bullish MACD crossover, positioning $3,600 as the next major price target.
Ethereum surged past $3,300 on January 14, 2026, as network activity reached unprecedented levels. The second-largest cryptocurrency by market cap gained 5.1% in 24 hours, trading at $3,377.32. Weekly gains climbed to 7.48%, pushing Ethereum’s market capitalization above $407 billion.
Trading volume spiked 84.31% in the last 24 hours. Analysts now point to $3,600 as the next major price target. The rally coincides with a record-breaking wave of new wallet creation on the Ethereum network.
The network added 393,000 new wallets in a single day, the highest figure ever recorded. Average daily wallet creation over the past week reached 327,000, according to Santiment data.
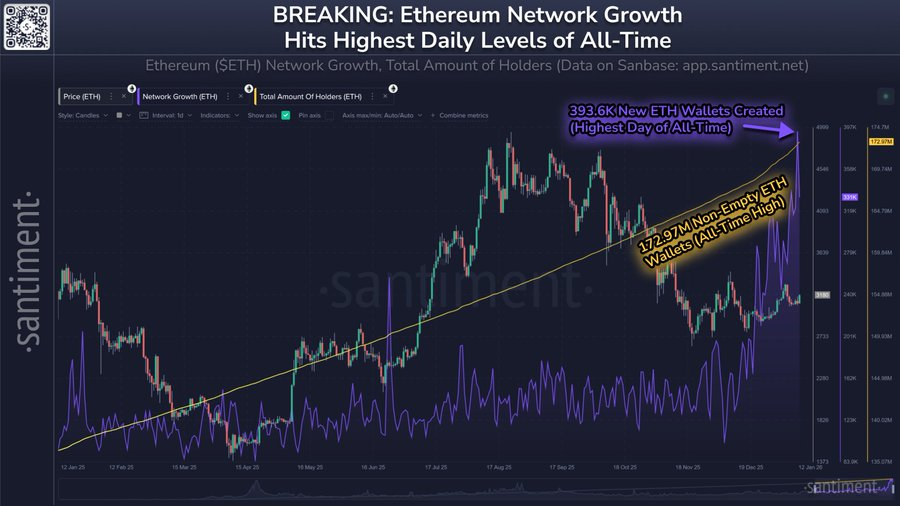
Ethereum Wallet Creation Hits Record High
The historic surge in wallet creation occurred while ETH traded below its 2025 peak. Santiment linked the growth to technical upgrades, practical usage, and shifting market sentiment.
The Fusaka upgrade, deployed in early December 2025, lowered costs for Layer-2 networks. The update improved data processing and reduced fees for posting data to the main chain. Users found it easier to engage with decentralized applications and rollups.
Stablecoin activity contributed significantly to adoption. Ethereum processed approximately $8 trillion in stablecoin transfers during Q4 2025. That figure represents the highest quarterly volume on record.
Social data revealed fresh participants entering the ecosystem since December. Holder sentiment shifted from negative to neutral or slightly positive in mid-December.
ETH ETF Flows and Institutional Activity
According to Lookonchain, Ethereum ETFs recorded strong daily inflows totaling 54,952 ETH, worth $181.51 million. BlackRock’s ETHA product saw 16,624 ETH in net inflows. Grayscale added 25,952 ETH to its holdings.
However, seven-day ETF flows showed net outflows of 47,684 ETH, valued at $157.5 million. BlackRock recorded outflows of 12,518 ETH over the week. Grayscale experienced 38,887 ETH in weekly outflows.
The divergence between crypto and traditional markets drew institutional attention. Major U.S. stock indices posted weekly losses. The Nasdaq fell 1.40%, while the Dow Jones dropped 1.21%. The S&P 500 declined by 1%.
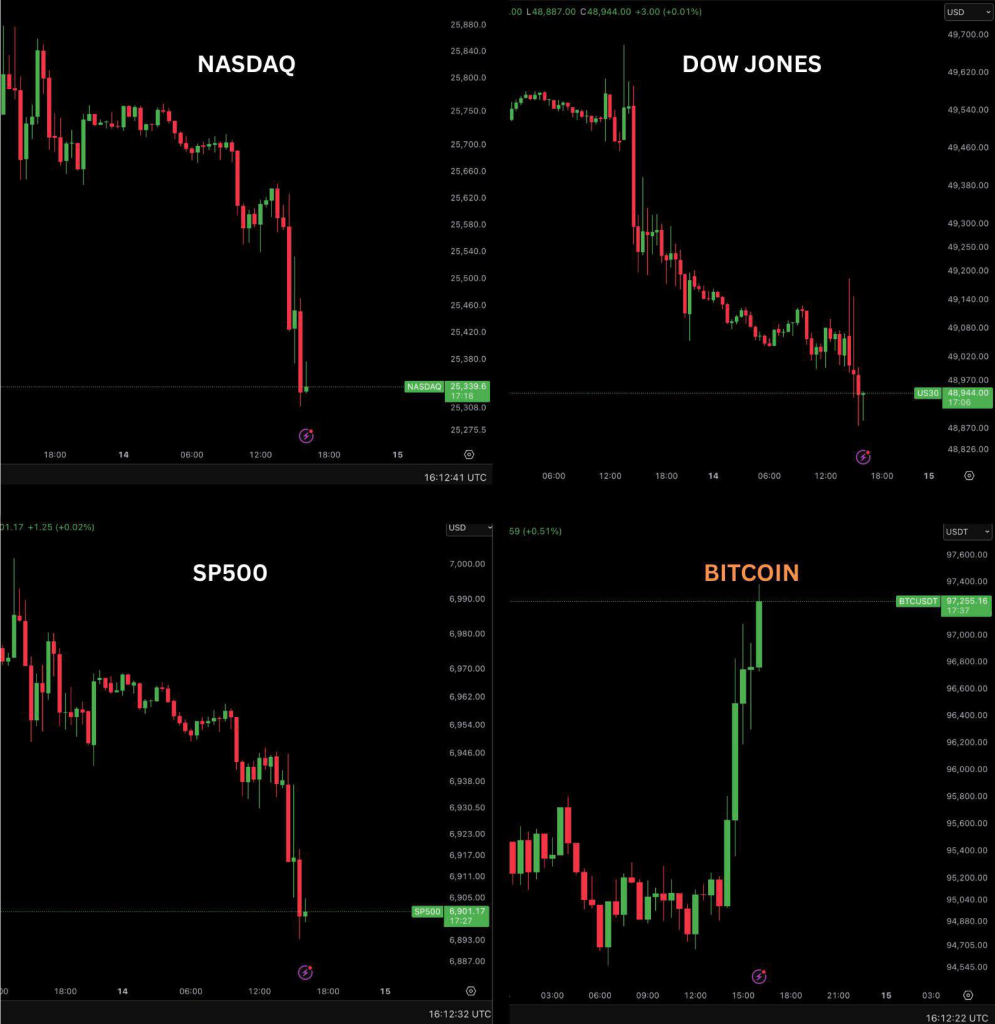
Bitcoin’s over 3% surge to $97,000 lifted the broader crypto market. ETF inflows of $753 million and $600 million in short liquidations drove Bitcoin higher. The total cryptocurrency market added $190 billion in 24 hours.
ETH futures open interest on Binance reached $8.6 billion, the highest since October 2025. U.S. inflation cooling to 2.6% boosted risk asset appetite across markets.
ETH Technical Analysis
Ethereum completed a symmetrical triangle breakout on the daily chart. The pattern formed from mid-November through mid-January. Price decisively cleared the $3,300 resistance level with increased volume.
The MACD indicator delivered a bullish crossover. The MACD line reads 55.50 against the signal line at 30.88. The histogram shows 24.62, with expanding green bars confirming accelerating momentum.
Bollinger Bands reveal expanding volatility. The upper band sits near $3,500, while the 20-day SMA rests at $3,352.65. Price trades approximately 8% above the 20-day SMA.
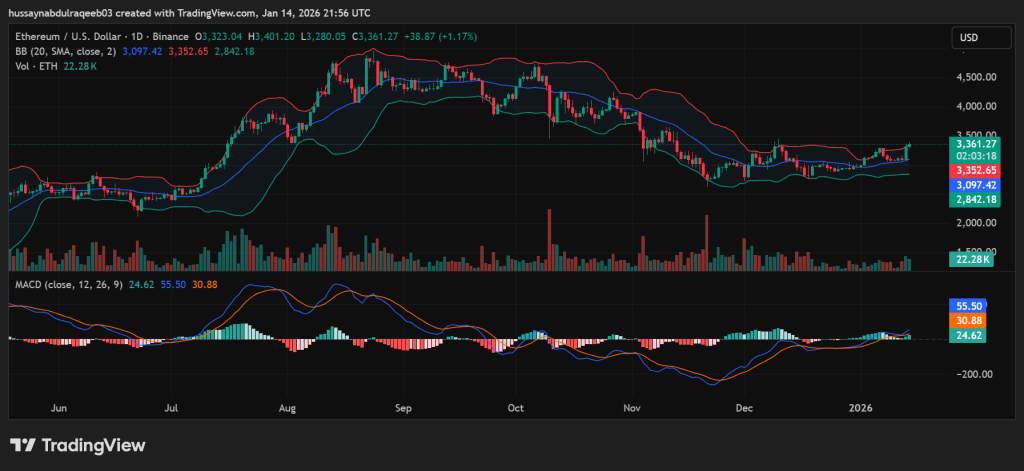
Immediate resistance stands at $3,400, marked by the recent breakout candle high. The next target appears at $3,500, a psychological level. Major resistance zones cluster between $3,600 and $3,650.
Support levels now include $3,300, the former resistance turned support. Secondary support sits at $3,250. Critical support remains at $3,150, the top of the triangle formation.
The 14-day RSI reads 64.71, positioned in bullish territory below overbought conditions. Analyst Merlijn the Trader identified $3,300 as the first key level cleared. He set $3,700 as the next upside target.
That Martini Guy stated a decisive break above $3,300 would open the path toward $3,600. The measured move from the triangle pattern projects a minimum target of $3,600. The breakout structure points to a bullish trajectory in the short term.
Disclaimer: Coinwaft is a crypto media platform providing cryptocurrency news, analysis, and trading information. The content of this article is for informational purposes only and should not be considered as financial, legal, or investment advice. Readers are advised once again to research or consult a financial expert before making any financial decision.
© 2026 Coinwaft. All Rights Reserved.

Abdul-Raqeeb Hussayn
Abdul-Raqeeb Hussayn
I'm a Web3 content writer with a Web2 marketing background. I create blogs, reports, and market analysis that make complex blockchain concepts clear for readers and credible for investors.
Author profileTrending Today
Seeker
SKR
$0.02

Bitcoin
BTC
$89,810.45
ETHGas
GWEI
$0.03

River
RIVER
$46.47

Pudgy Penguins
PENGU
$0.01

XRP
XRP
$1.96

Lighter
LIT
$1.75

Solana
SOL
$130.15
newsletter
Busy Wealth
Join the Busy Wealth newsletter that helps thousands of investors get early alpha and understand the crypto market.
By pressing the "Subscribe button" you agree with our Privacy Policy.
Crypto Today