 Coinwaft
Bitcoin Climbs Back Above $67K Despite 100 Days of Losses and $730B Market Wipeout
Whale deposits to Binance reach $8.3 billion as crypto market sheds $730 billion in 100-day capital flight
7 hours ago
Last updated
7 hours ago

KEY FACTS
- Bitcoin reclaims $67,700 with 2.12% daily gain as Binance whale inflows reach $8.3 billion, the highest since 2024
- Crypto market loses $730 billion in 100 days with Bitcoin alone shedding $347.9 billion in value
- Exchange whale ratio hits 0.64, the highest since 2015, while stablecoin inflows compress sharply
Bitcoin has climbed back above $67,000 as whale inflows to Binance reached their highest level since 2024. The recovery comes despite a severe $730 billion contraction across the broader cryptocurrency market over the past 100 days.
The leading cryptocurrency now trades at $67,716.62, posting a 2.12% gain in 24 hours. However, weekly performance remains negative at 1.83%. The market cap stands at $1.35 trillion following a 1.95% recovery in the latest session.
According to Lookonchain, Bitcoin ETFs continue facing outflows. Daily net flow reached negative 2,414 BTC, equivalent to $160.71 million. The seven-day net flow totaled negative 7,194 BTC, worth approximately $479 million.
Bitcoin Whale Inflows to Binance Hit Highest Level Since 2024
On-chain data reveals a dramatic surge in whale deposits to Binance. The 30-day average of whale inflows has reached approximately $8.3 billion. This marks the highest level recorded since 2024.
The exchange whale ratio climbed to 0.64, the highest reading since 2015. This metric indicates top inflows now account for the majority of exchange deposits. Average BTC deposit sizes have reached levels last observed in mid-2022.
Historically, elevated whale inflows often precede increased volatility or market structure transitions. Large holders may be positioning for potential sales or reallocating positions. However, the activity could also represent strategic liquidity management or derivatives positioning.
Bitcoin exchange inflows have normalized following an early February capitulation spike. Inflows surged to approximately 60,000 BTC during the correction to $60,000 but have since declined to roughly 23,000 BTC on a seven-day average.
Bitcoin Market Sheds $347.9 Billion Amid $730 Billion Crypto Contraction
The cryptocurrency market has shed more than $730 billion in total value over the past 100 days. Bitcoin alone accounts for $347.9 billion in losses, declining from $1.6968 trillion to $1.3489 trillion. This represents a 21.62% drop.
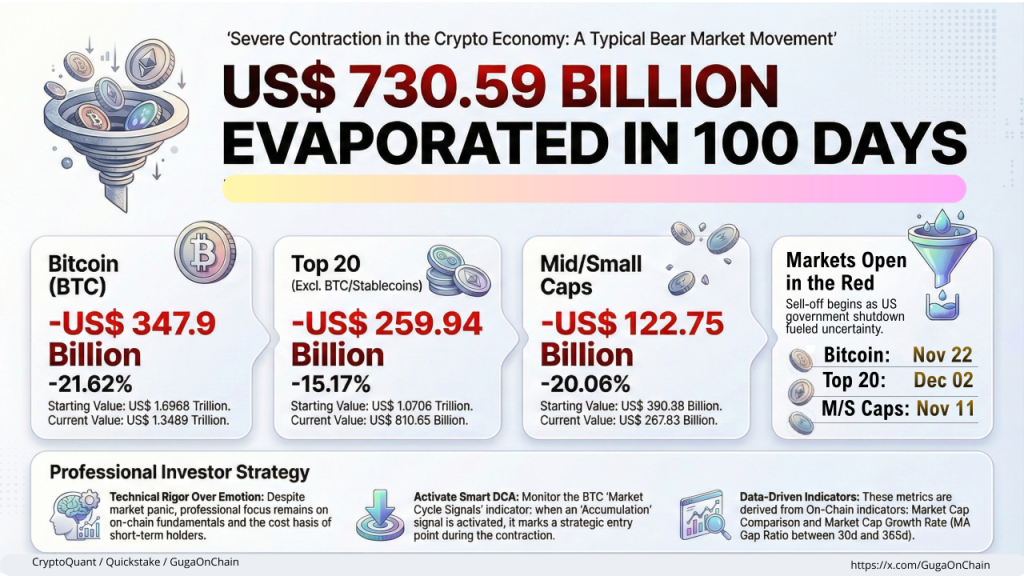
The top 20 cryptocurrencies, excluding Bitcoin and stablecoins, fell from $1.0706 trillion to $810.65 billion. This segment lost $259.94 billion, a decline of 15.17% since early December.
Mid and small-cap altcoins suffered the harshest proportional losses. This segment dropped from $390.38 billion to $267.63 billion, losing $122.75 billion or 20.06% of its value.
Stablecoin flows reveal declining buying power. Net USDT flows into exchanges compressed from $616 million in November 2025 to just $27 million. Flows turned negative at times, reaching minus $469 million in late January.
Altcoin exchange deposits have increased to an average of 49,000 daily in 2026, up from 40,000 in Q4 2025. Elevated altcoin deposits typically precede heightened volatility.
Bitcoin Price Structure and Key Levels
Bitcoin trades within an established downtrend structure on the daily chart. The price has declined approximately 44% from its cycle peak near $120,000. A series of lower highs and lower lows has defined price action since January 2026.
Immediate support sits at $65,000 to $66,000, where recent capitulation produced a long-wick rejection candle. Major support lies at $60,000 to $62,000, a previous breakout zone with heavy historical accumulation.
The 9-period EMA at $67,986 serves as dynamic resistance. Price currently oscillates around this level with a downward slope. A daily close above $68,000 would be needed for short-term bullish confirmation.
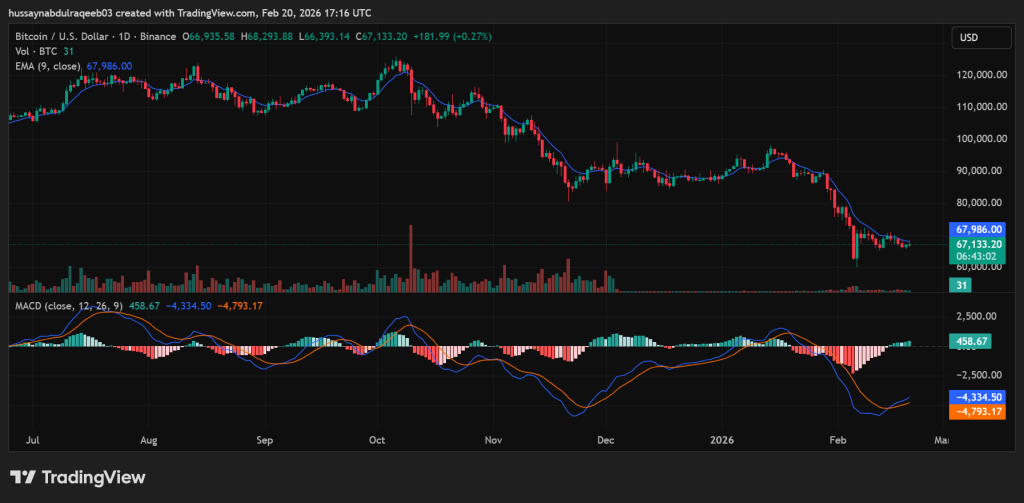
The MACD reads deeply negative with the main line at minus 4,334.50 and signal line at minus 4,793.17. However, the histogram shows compression at 458.67. A bullish crossover appears imminent within one to three days.
Volume analysis reveals a capitulation spike at the $65,000 low followed by declining participation during the current bounce. The pattern suggests a relief rally rather than a confirmed reversal.
Key resistance levels stand at $72,000 to $74,000 for structural breakout confirmation and $78,000 to $80,000 as a psychological barrier. Near-term trajectory remains bearish until price reclaims the 9 EMA with sustained volume.
Disclaimer: Coinwaft is a crypto media platform providing cryptocurrency news, analysis, and trading information. The content of this article is for informational purposes only and should not be considered as financial, legal, or investment advice. Readers are advised once again to research or consult a financial expert before making any financial decision.
© 2026 Coinwaft. All Rights Reserved.

Abdul-Raqeeb Hussayn
Abdul-Raqeeb Hussayn
I'm a Web3 content writer with a Web2 marketing background. I create blogs, reports, and market analysis that make complex blockchain concepts clear for readers and credible for investors.
Author profileTrending Today

PEPETO
PEPETO
$0.16

Bitcoin
BTC
$64,885.33

Pudgy Penguins
PENGU
$0.01

World Liberty Financial
WLFI
$0.11

Solana
SOL
$78.84

Hyperliquid
HYPE
$26.48

Ethereum
ETH
$1,866.13

USD1
USD1
$1
newsletter
Busy Wealth
Join the Busy Wealth newsletter that helps thousands of investors get early alpha and understand the crypto market.
By pressing the "Subscribe button" you agree with our Privacy Policy.
Crypto Today