 Coinwaft
Solana Regains $81 Amid Growing Network Activity and Rising Achievements
SOL rebounds from two-year low as ETFs record $7.3M daily inflow and Citi completes on-chain trade finance tokenization
1 hour ago
Last updated
1 hour ago

KEY FACTS
- Solana reclaims $81 price level after hitting a two-year low, posting 1.18% daily gains
- Network milestones include $1.02B ETF inflows, 200M daily transactions, and Citi tokenizing trade finance on-chain
- Technical analysis shows neutral consolidation with key support at $80 and resistance at $101-$105
Solana has reclaimed the $81 price level following a steep decline that pushed the token to a two-year low. The cryptocurrency now trades at $81.68, posting a 1.18% gain over the past 24 hours. Despite this recovery, SOL remains down 11.56% from the previous week. The market capitalization stands at approximately $46.38 billion.
Exchange-traded funds tracking Solana recorded a net daily inflow of 88,980 SOL, equivalent to $7.3 million, according to Lookonchain. Weekly ETF outflows, however, totaled 76,064 SOL, valued at $6.24 million.
The price movement mirrors Bitcoin’s 1.09% gain during the same period. The total crypto market cap rose 1.28%, while market sentiment remains at “Extreme Fear” with an index reading of 8.
2025 Solana Milestones Mark Institutional Adoption
US spot Solana ETFs launched in 2025, accumulating $1.02 billion in net inflows. The products recorded a 21-day consecutive inflow streak, marking the most successful ETF launch of the year.
Treasury firms staked 12.5 million SOL, representing 3% of the total supply. Public companies issued bonds specifically to purchase SOL tokens.
BlackRock and other major players tokenized $10 billion in real-world assets on Solana. Circle’s CEO confirmed Solana achieved USDC volume supremacy. The stablecoin supply reached $14.8 billion, doubling previous figures, with $11.7 trillion in transfers processed.
Western Union announced plans to launch a stablecoin on the Solana network. Galaxy tokenized their stock on the blockchain. State Street and Franklin Templeton are exploring similar opportunities.
Solana Network Metrics and Ecosystem Expansion
The Solana network processed over 200 million daily transactions with latency below 400 milliseconds. Average transaction fees remained at $0.017. The network maintained continuous uptime for 16 consecutive months.
Ecosystem applications generated $2.39 billion in revenue, a 46% increase. Network revenue reached $1.4 billion, a 48-fold increase over two years. Seven applications exceeded $100 million in individual revenue.
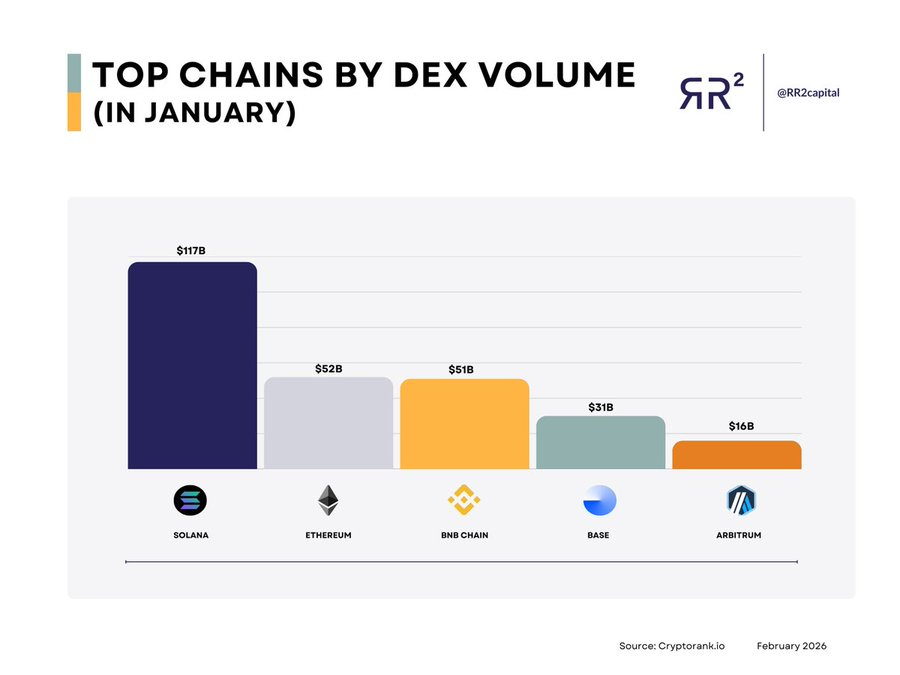
DEX volume on Solana reached $1.5 trillion, up 57% year-over-year. SOL-stablecoin pairs handled $782 billion in volume. Twelve decentralized exchanges processed over $10 billion each.
The ecosystem welcomed 725 million new wallets. Daily active users reached 3.2 million, a 50% increase. Developer growth surged 83%, adding 7,625 new developers to the network.
Citi Tokenizes Trade Finance on Solana
Banking giant Citi represented a bill of exchange as a token on the Solana blockchain. The institution executed the instrument’s entire lifecycle, from issuance to settlement, on-chain.
Citi continues building through its CIDAP platform, which supports both public and private chains. The bank plans to launch crypto custody services in 2026.
Solana became the top chain by DEX volume, surpassing Ethereum, BNB Chain, Base, and Arbitrum.
Zheng Jie Lim of Artemis noted Solana leads in users, transactions, developer growth, trading volume, and fees, he said:
Solana is number one in users, transactions, developer growth, trading volume, and fees with 24+ consecutive months of uptime. A marketplace for financial apps and users. That’s how Solana becomes the internet capital markets.
SOL Price Structure Shows 66% Drop From Highs
SOL trades near $81.97 on the daily chart, following a 66% decline from September 2025 highs near $240. The price structure displays consecutive lower highs and lower lows.
Bollinger Bands show significant expansion with price hugging the lower band near $67.09. The middle band at $101.45 serves as immediate resistance. The MACD reads -12.62 with the signal line at -11.28, both deep in negative territory.
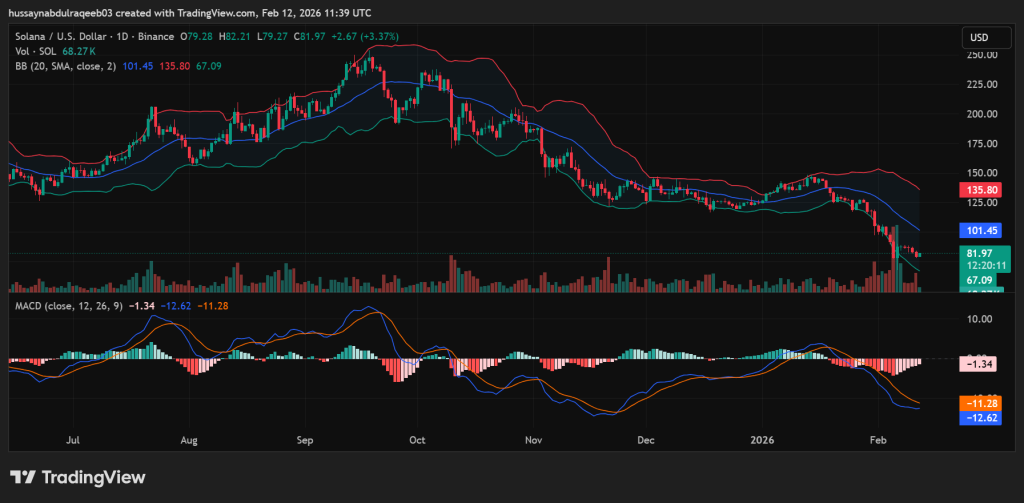
Immediate support sits at the $80-$82 zone. A break below $80 targets $67-$70, aligned with the lower Bollinger Band. Extended downside targets include $60 and $55.
Resistance levels cluster at $95-$100 and $101-$105, the latter coinciding with the 20-day moving average. The 14-day RSI at 49.23 indicates neutral conditions with room for movement in either direction.
The bearish continuation scenario carries higher probability at 65%. Confirmation requires a close above $83.75 for bullish momentum or a break below $78.40 for continued selling. The near-term outlook remains neutral consolidation pending directional confirmation.
Disclaimer: Coinwaft is a crypto media platform providing cryptocurrency news, analysis, and trading information. The content of this article is for informational purposes only and should not be considered as financial, legal, or investment advice. Readers are advised once again to research or consult a financial expert before making any financial decision.
© 2026 Coinwaft. All Rights Reserved.

Abdul-Raqeeb Hussayn
Abdul-Raqeeb Hussayn
I'm a Web3 content writer with a Web2 marketing background. I create blogs, reports, and market analysis that make complex blockchain concepts clear for readers and credible for investors.
Author profileTrending Today

Pudgy Penguins
PENGU
$0.01

Espresso
ESP
$0.07

Aztec
AZTEC
$0.02
pippin
PIPPIN
$0.51

Bittensor
TAO
$155.34

LayerZero
ZRO
$1.93

Aave
AAVE
$115

Bitcoin
BTC
$66,343.19
newsletter
Busy Wealth
Join the Busy Wealth newsletter that helps thousands of investors get early alpha and understand the crypto market.
By pressing the "Subscribe button" you agree with our Privacy Policy.
Crypto Today