 Coinwaft
Bitcoin Falls to $66K Amid Weak Inflows and Mounting Bear Market Signals
Capital outflows hit $2.6 billion as derivatives deleveraging amplifies selling pressure and volatility spikes to 2022 highs
8 hours ago
Last updated
8 hours ago

KEY FACTS
- Bitcoin drops to $66,804 with $2.6B in cumulative 30-day capital outflows
- Derivatives market sheds 9.25% in open interest as $111M in BTC liquidated
- Seven-day volatility reaches highest level since 2022 structural crisis
Bitcoin has slipped below the $67,000 mark as fresh capital fails to enter the market. The leading cryptocurrency now trades at $66,804.67, reflecting a 2.48% decline over 24 hours and a 12.01% drop over the past week.
The market capitalization has contracted to $1.3 trillion. Cumulative 30-day capital flows stand at negative $2.6 billion, with dips failing to attract new participants. Historical inflow spikes typically observed during uptrends remain absent from current market conditions.
Meanwhile, the broader crypto market has experienced parallel pressure. The total cryptocurrency market cap fell 2.07%, confirming a widespread risk-off environment across digital assets.
Bitcoin Derivatives See $111M in Liquidations as Leverage Unwinds
The derivatives sector has undergone significant deleveraging over the past 24 hours. Perpetual open interest dropped 9.25% to $518.08 billion. The average funding rate turned negative at -0.00095706%, reflecting bearish positioning.
Liquidations totaled over $111 million in Bitcoin alone during this period. Long positions accounted for $86 million of that figure. This unwinding of leveraged bets has amplified selling pressure throughout the market.
Bitcoin exchange-traded funds recorded a net daily inflow of 417 BTC, equivalent to $28.97 million. Weekly ETF outflows, however, reached 11,607 BTC, valued at $805.89 million, according to data from Lookonchain.
The shedding of leverage during the downtrend intensifies immediate selling pressure. However, this deleveraging also reduces systemic risk across the broader market infrastructure.
Bitcoin Volatility Spikes to Highest Levels Since 2022
Bitcoin’s seven-day annualized volatility reading has climbed to approximately 1.51 on Binance. This level marks the highest volatility since 2022, a period associated with sharp structural shifts and widespread deleveraging.
The 30-day annualized volatility hovers around 0.81, while 90-day volatility sits near 0.56. This downward gradient across timeframes suggests recent spikes have remained confined to shorter bursts rather than sustained regime change.
The Average True Range reading as a percentage stands at approximately 0.075. This historically low level indicates the average daily trading range has narrowed compared with periods of panic or strong rallies.
Such low-range environments often establish price bases before new trends emerge. The market appears to be consolidating energy after prolonged fluctuations, increasing the likelihood of a clearly directional move.
BTC Price Tests Critical Support as Momentum Turns Bearish
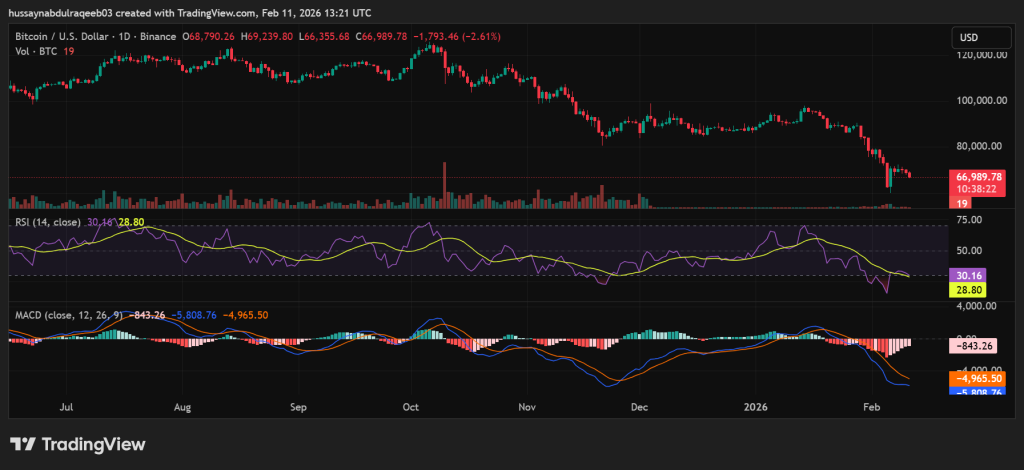
Bitcoin trades below its 30-day simple moving average of $68,382 and the 50% Fibonacci retracement level at $68,159. The immediate trading range extends between support at $66,364 and resistance at $68,159.
The Relative Strength Index reads 30.16, placing the asset in oversold territory. The MACD line sits at -843.26 with the signal line at -5,808.76, confirming deep negative momentum. The histogram at -4,965.50 shows expanding red bars.
The loss of the 0.618 Fibonacci level near $69,000-$71,000 represents a critical technical development. This golden ratio breach typically distinguishes healthy corrections from trend reversals. The next major Fibonacci support at the 0.786 level aligns with the $60,000-$62,000 zone.
Volume analysis reveals significant selling during the breakdown from October highs near $105,000. Elevated volume during the recent decline to $66,000 suggests distribution rather than passive profit-taking. No volume exhaustion has appeared yet.
A potential head and shoulders top pattern has formed with the neckline at $75,000-$80,000 already broken. The measured target for this pattern points to the $50,000-$55,000 range.
The path of least resistance remains sideways to down until Bitcoin reclaims the $68,159-$68,382 zone. A daily close above $68,382 would suggest a near-term trend reversal. If selling pressure continues and $66,364 fails, the next major support sits at the 200-day SMA near $70,527.
The key stabilization factor depends on holding the $66,364 support level while funding rates recover from negative territory. Price trajectory remains bearish until these conditions shift.
Disclaimer: Coinwaft is a crypto media platform providing cryptocurrency news, analysis, and trading information. The content of this article is for informational purposes only and should not be considered as financial, legal, or investment advice. Readers are advised once again to research or consult a financial expert before making any financial decision.
© 2026 Coinwaft. All Rights Reserved.

Abdul-Raqeeb Hussayn
Abdul-Raqeeb Hussayn
I'm a Web3 content writer with a Web2 marketing background. I create blogs, reports, and market analysis that make complex blockchain concepts clear for readers and credible for investors.
Author profileTrending Today

Berachain
BERA
$1.23

LayerZero
ZRO
$2.29
Uniswap
UNI
$3.49

Pudgy Penguins
PENGU
$0.01

Hyperliquid
HYPE
$29.84

Bittensor
TAO
$148.53

Bitcoin
BTC
$67,597.56

Aave
AAVE
$108.89
newsletter
Busy Wealth
Join the Busy Wealth newsletter that helps thousands of investors get early alpha and understand the crypto market.
By pressing the "Subscribe button" you agree with our Privacy Policy.
Crypto Today