 Coinwaft
Solana Slips to $142 as RWA TVL Hits $1B ATH — Is a Breakout Brewing?
RWA ecosystem milestone and network dominance clash with broader market rotation as SOL tests critical support levels
5 days ago
Last updated
5 days ago

KEY FACTS
- Solana price dropped to $142.88 despite RWA ecosystem reaching historic $1 billion TVL milestone.
- Network dominates with 60M+ monthly users and $100B in DEX volume, outpacing Ethereum and BSC combined.
- Technical analysis shows neutral-to-bearish bias with $137.93 as critical support and $146.16 as key resistance.
Solana dropped below $145 this week even as its real-world asset ecosystem reached a historic $1 billion in total value locked. The contradiction has traders questioning whether a major breakout is imminent or if further downside awaits.
At press time, SOL trades at $142.88, down 1.69% in 24 hours but up 3.03% over the past seven weeks. Market capitalization fell to $80.77 billion while trading volume plunged 30.76% in a single day.
The RWA milestone marks a dramatic transformation. Just one year ago, Solana’s RWA TVL stood at zero. Now it has crossed the billion-dollar threshold, attracting institutional attention to the network.
Solana Leads Blockchain Activity Amid Altcoin Pressure
Solana currently ranks as the most actively used blockchain in crypto. Over 60 million users engaged with the network in the past 30 days, surpassing both Ethereum and Base significantly.
Fee generation tells a similar story of dominance. According to DefiLlama, Solana collected over $17 million in fees within 24 hours as on-chain activity surged.
The network also overtook Ethereum and BSC in decentralized exchange volume. Solana processed over $100 billion in DEX transactions over 30 days. Ethereum and BSC combined handled only $87 billion during the same period.
Acccording of Lookonchain, on January 15, Solana ETFs recorded strong inflows, with a one-day net flow of 158,237 SOL worth $23.1 million. Weekly net flows reached 379,484 SOL, totaling $55.4 million.
Meanwhile, broader market dynamics created pressure. Bitcoin dominance rose to 59.15%, climbing 0.51% in 24 hours. Capital rotated from altcoins toward BTC as risk appetite declined.
The Altcoin Season Index collapsed 46.94% weekly to 26. This metric signals reduced enthusiasm for assets like SOL. Bitcoin derivatives liquidations totaling $51.54 million indirectly pressured correlated altcoins.
Solana Validator Migration Lags Behind Schedule
Network upgrade delays added another layer of uncertainty. Solana released its critical v3.0.14 update on January 10. However, only 18% of validators had migrated by January 15.
The slow adoption rate revived concerns about network coordination despite no active exploits occurring. Developers designed the upgrade to bolster long-term stability.
Market observers view the delayed migration as a transient sentiment issue rather than a fundamental flaw. The perception risk may spook short-term holders seeking immediate confidence signals.
SOL Price Tests Key Support Levels
SOL/USDT trades at $143.14 with the daily range spanning $141.39 to $143.63. Volume sits at 754,710 SOL, reflecting moderate but not exceptional participation.
Price action reveals a clear downtrend from September’s $210 peak. Lower highs established a descending channel pattern. Recent recovery attempts from November lows near $120-$125 have stalled.
The $146.16 level serves as primary resistance after a rejection on January 14. Secondary resistance lies in the $150-$155 zone. Major resistance sits at $175-$180 from previous structure.
Critical support levels include $141.39 as the immediate floor. A breakdown below $137.93 could accelerate selling toward $125-$130. The $120 level represents major support from November lows.
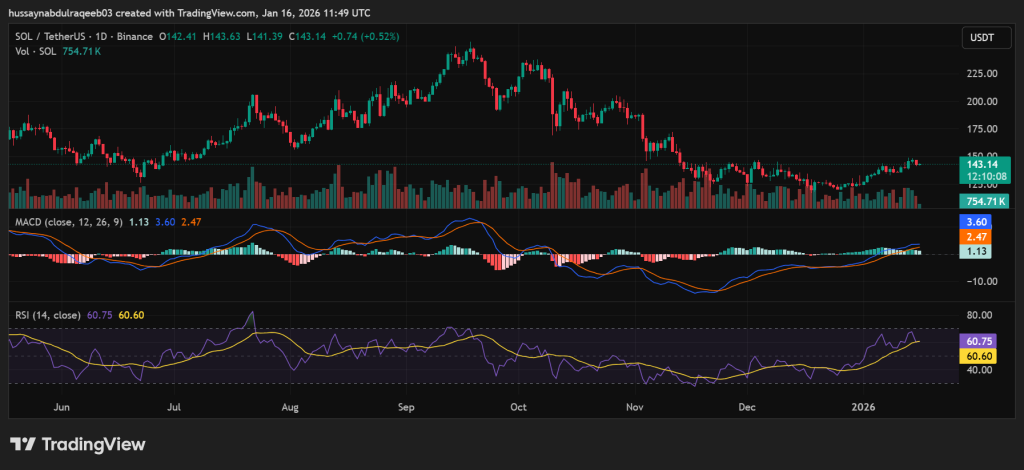
The MACD currently reads 1.13 against a 3.60 signal line with a 2.47 histogram. A positive crossover remains intact above zero. However, the histogram is declining from recent peaks.
RSI hit an extreme overbought reading of 78.57 on January 14, triggering profit-taking. The indicator has since cooled to 60.75, remaining above the neutral 50 midpoint.
Consolidation between $125 and $146 appears likely without a clear catalyst. The $137.93 support level remains the critical breakdown point for near-term direction.
Current technical bias sits neutral to slightly bearish. Price must stabilize above $143-$145 with improving volume for bullish confirmation. A reclaim of $146.16 would open the path toward $155-$160.
Disclaimer: Coinwaft is a crypto media platform providing cryptocurrency news, analysis, and trading information. The content of this article is for informational purposes only and should not be considered as financial, legal, or investment advice. Readers are advised once again to research or consult a financial expert before making any financial decision.
© 2026 Coinwaft. All Rights Reserved.

Abdul-Raqeeb Hussayn
Abdul-Raqeeb Hussayn
I'm a Web3 content writer with a Web2 marketing background. I create blogs, reports, and market analysis that make complex blockchain concepts clear for readers and credible for investors.
Author profileTrending Today
Seeker
SKR
$0.02
ETHGas
GWEI
$0.03

Oasis
ROSE
$0.02

Ondo
ONDO
$0.35

Pudgy Penguins
PENGU
$0.01

River
RIVER
$46.75

Solana
SOL
$130.99

Zcash
ZEC
$368.81
newsletter
Busy Wealth
Join the Busy Wealth newsletter that helps thousands of investors get early alpha and understand the crypto market.
By pressing the "Subscribe button" you agree with our Privacy Policy.
Crypto Today