 Coinwaft
XRP Falls 8.2% in a Day — Will New ETF Approvals Spark a Reversal?
XRP Slides 8% as Market Stress Intensifies with ETF Outflows, Weak Futures Activity, and Profit-Taking Weighing on Price
November 20, 2025 at 6:42 PM
Last updated
November 20, 2025 at 6:42 PM

KEY FACTS
- XRP is down today mainly due to a broader crypto market sell-off, with Bitcoin’s weakness dragging major altcoins lower.
- Regulatory uncertainty around Ripple’s ongoing SEC case continues to weigh on investor confidence, limiting upside momentum.
- Large liquidations and high leverage across altcoins have added extra selling pressure, accelerating XRP’s intraday drop.
- XRP’s chart remains firmly bearish, with price sitting on the crucial $2.00 support and momentum indicators all signaling room for further downside.
XRP has dropped 8.2% in the last 24 hours, trading at $2.05 and extending its weekly loss to 14%. The decline pushed its market capitalization lower amid broader crypto market weakness rather than token-specific developments.
The entire crypto market fell nearly 5% in 24 hours. Bitcoin spot ETFs recorded their heaviest outflows since February, including $523 million from BlackRock’s IBIT in a single day.
Despite the downturn, nine XRP exchange-traded funds launched within days. Analysts note this institutional product rollout occurred faster than previous launches for Bitcoin or Ethereum.
XRP ETF Launches Accelerate Despite Market-Wide Selloff
The first U.S.-listed XRP option-income ETF, Amplify XRPM, officially launched this week. The product offers institutions a yield-focused vehicle for XRP exposure.
Canary Capital XRP ETF (XRPC) launched with $245 million in day-one inflows and $58 million in trading volume. The fund’s in-kind structure allows large holders to transfer XRP without hitting public markets.
This structure reduces sell pressure and increases institutional accessibility. Meanwhile, the Fear & Greed Index dropped to 16 out of 100, triggering extreme fear across markets.
XRP historically shows high beta relative to Bitcoin during selloffs. As BTC ETFs lose capital, liquidity drains first from altcoins, amplifying XRP volatility.
Glassnode data shows 26.5 billion XRP, representing 41.5% of supply, is currently held at a loss. This marks the highest level since 2024.
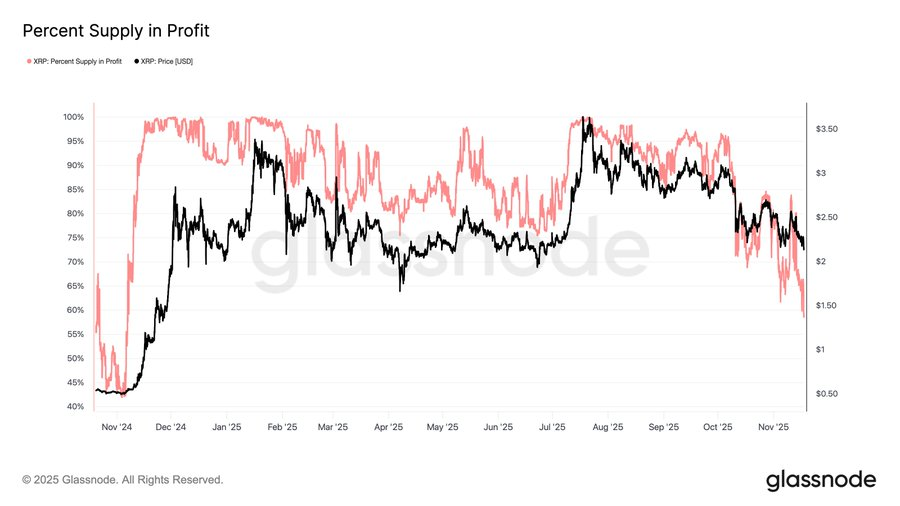
Long-term holders recently realized $220 million in profits per day, a 240% increase since September. Many traders used ETF-related optimism to lock in gains, adding downward pressure.
XRP Futures Activity Drops as Profit-Taking Accelerates
Retail demand for XRP remains muted. CoinGlass data shows futures open interest at $3.61 billion, barely changed from $3.63 billion the previous day.
Open interest remains far below the July peak of $10.94 billion. This 62% decline signals a weak derivatives market with low retail speculation.
Traders are not positioning aggressively for upside, reflecting lack of confidence in immediate bullish momentum. A “sell-the-news” dynamic emerged following ETF launches.
Volume dropped 30% to $4.75 billion. Declining volume throughout the downtrend suggests a capitulation phase with reduced buyer conviction at current levels.
Following the ETF launches, sustained inflows or stabilization in Bitcoin could help XRP recover. However, technical indicators point to continued weakness in the near term.
XRP Technical Indicators Point to Further Downside Risk
XRP trades at $2.08, testing critical psychological support at $2.00. The token lost both its 7-day moving average at $2.26 and 30-day moving average at $2.40.
The Relative Strength Index sits at 36.26, remaining in bearish territory below 50. RSI has trended downward consistently since October but has not reached oversold conditions below 30.
This leaves room for approximately 7% to 10% more downside before oversold levels appear. MACD confirmed a bearish crossover with both lines below zero, indicating strong bearish momentum.
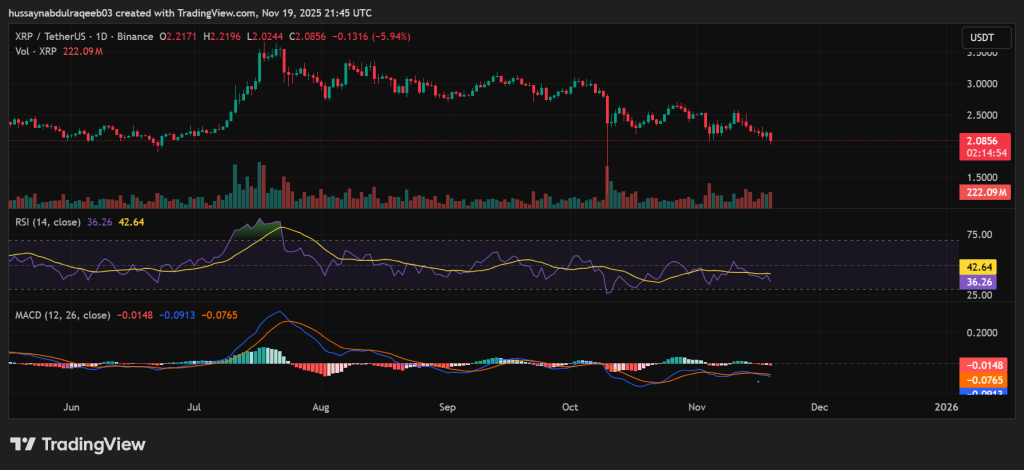
The histogram shows negative divergence with no signs of bullish reversal. MACD lines are flattening but not converging, suggesting continued weakness ahead.
Immediate resistance stands at $2.26, with major resistance at $2.40 and $2.50. Critical support sits at $2.00, followed by $1.90 to $1.95.
A close below $2.00 could trigger algorithmic selling and futures liquidations. Stop-losses likely cluster around $2.00 and $1.95, creating cascade risk on breakdown.
The chart displays a descending channel from July’s peak near $3.20, forming lower highs and lower lows. No reversal patterns have emerged yet.
If $2.00 breaks, the first target sits at $1.90, representing an 8.9% decline. The second target reaches $1.75, marking a 16% drop from current levels.
For trend reversal, XRP must reclaim $2.26 on volume exceeding 300 million, with RSI breaking above 50 and MACD crossing above zero. The near-term trajectory remains bearish.
Disclaimer: Coinwaft is a crypto media platform providing cryptocurrency news, analysis, and trading information. The content of this article is for informational purposes only and should not be considered as financial, legal, or investment advice. Readers are advised once again to research or consult a financial expert before making any financial decision.
© 2026 Coinwaft. All Rights Reserved.

Abdul-Raqeeb Hussayn
Abdul-Raqeeb Hussayn
I'm a Web3 content writer with a Web2 marketing background. I create blogs, reports, and market analysis that make complex blockchain concepts clear for readers and credible for investors.
Author profileTrending Today

Bitcoin
BTC
$76,043.13

TRIA
TRIA
$0.02

Pudgy Penguins
PENGU
$0.01

Zama
ZAMA
$0.03

Solana
SOL
$97.17

Hyperliquid
HYPE
$33.06

Tether Gold
XAUT
$5,070.28

River
RIVER
$13.65
newsletter
Busy Wealth
Join the Busy Wealth newsletter that helps thousands of investors get early alpha and understand the crypto market.
By pressing the "Subscribe button" you agree with our Privacy Policy.
Crypto Today