 Coinwaft
Bitcoin and Ethereum Falls to $66K and $1.9k respectively as $8.8 Billion in the Crypto Options Expire — Is Volatility Next?
Options expiry sees 115,000 BTC contracts worth $7.8B and 479,000 ETH contracts settle as traders brace for potential market swings
22 hours ago
Last updated
22 hours ago

KEY FACTS
- Bitcoin dropped 3.02% to $66,026 and Ethereum fell 4.86% to $1,961 as $8.8 billion in crypto options expired on Deribit
- Max pain levels at $75,000 for BTC and $2,200 for ETH remain well above current spot prices with most contracts expiring out-of-the-money
- Bitcoin ETFs recorded $394M daily inflows while a major OTC whale sold 23,500 ETH amid $135M unrealized losses
Bitcoin and Ethereum have retreated from recent highs as $8.8 billion worth of cryptocurrency options expired on Deribit. Bitcoin dropped to $66,026, down 3.02% in 24 hours. Ethereum fell to $1,961, marking a 4.86% daily decline after briefly reclaiming the $2,000 level.
The expiry covered 115,000 Bitcoin contracts valued at $7.8 billion and 479,000 Ethereum contracts worth nearly $1 billion. Call options dominated both assets, with put/call ratios around 0.73-0.78 for Bitcoin and 0.77-0.78 for Ethereum.
Max pain levels stood at $75,000 for Bitcoin and $2,200 for Ethereum. Current spot prices traded substantially below these thresholds at expiry time. Most contracts expired out-of-the-money, potentially easing resistance above $70,000 for Bitcoin.
Bitcoin’s market capitalization declined to approximately $1.32 trillion from $1.36 trillion over 24 hours, while2 Ethereum’s market cap fell to $236.96 billion following a 4.76% wipeout, though it maintained a 0.86% weekly gain.
ETF Flows Show Mixed Signals Amid Options Expiry
Bitcoin ETFs recorded positive inflows despite the price decline. According to Lookonchain, one-day net flow reached 5,847 BTC worth $394.06 million. Seven-day net flow totaled 5,195 BTC valued at $350.12 million.
Ethereum ETFs presented a contrasting picture. Daily inflows showed 51,705 ETH worth $105.48 million entering the funds. However, seven-day data revealed outflows of 42,931 ETH totaling $87.58 million.
A significant OTC whale appears to be capitulating on positions accumulated during the market downturn. The trader sold 23,500 ETH worth $47.77 million to repay loans. Between January 8 and February 2, this whale purchased 163,405 ETH at $2,691 average.
The same trader bought 4,000 cbBTC worth $296 million at $74,004 average between February 2 and February 5. Current unrealized losses stand at approximately $135 million on these positions.
Options Expiry Mechanics and Market Impact
Options expiry forces traders to close or exercise their positions. Market makers adjust hedges accordingly, often creating elevated trading volume. Large institutional players frequently reposition around these events.
The settlement occurred around 08:00 UTC on Deribit. Analysts warned of lingering volatility from leverage and gamma effects. Delta hedging by market makers can amplify price movements in either direction.
Price action typically gravitates toward max pain levels before expiry. This mechanism maximizes losses for option holders and benefits option sellers. Bitcoin would need a 10-12% surge to reach its $75,000 max pain level.
Post-expiry periods often see volatility compression as gamma effects fade. The market may consolidate or resume its prior trend. Recent weeks brought selling pressure from ETF outflows and macroeconomic concerns.
Bitcoin Technical Analysis: Bearish Trend Intact as Weak Momentum and Low Volume Limit Recovery Attempts
Bitcoin’s daily chart shows a confirmed downtrend via lower highs and lower lows. All three major moving averages maintain bearish alignment. Price trades below all significant moving averages with a declining upper Bollinger Band trajectory.
The Bollinger Bands show current support between $64,400 and $64,500 at the lower band. Immediate resistance sits at $67,600 to $68,000 at the middle band. The upper band provides resistance near $70,800 to $71,500.
MACD readings show early-stage momentum deceleration rather than reversal. The MACD line at -3,123.87 approaches the signal line at -3,767.34 from below. Histogram bars turned positive at 643.48, suggesting potential bullish crossover.
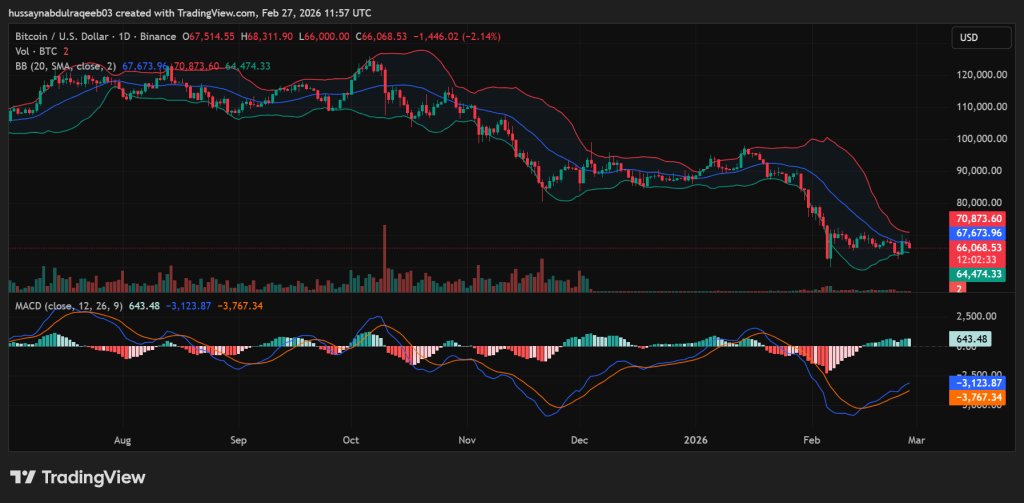
Volume analysis reveals declining activity on the recent bounce from $60,000 lows. Below-average volume during current consolidation indicates lack of strong buying conviction. February 2026 showed massive capitulation volume at lows.
Critical support levels include $60,000 psychological support and the $58,000-$59,000 capitulation zone. Major resistance zones sit at $73,000-$75,000 and $78,000-$80,000. A close above the middle Bollinger Band at $67,600 would signal initial momentum shift.
The near-term trajectory remains bearish while price stays below the 20-day SMA. Traders should watch for volume expansion above $68,000 to confirm bullish intent. Failure to reclaim $70,000 keeps downside risks elevated toward the $60,000 support zone.
Ethereum Technical Outlook: Bearish Structure Holds as ETH Consolidates Near $2,000
Ethereum is trading around $1,960, remaining in a medium-term downtrend after peaking near $4,800. The breakdown below $3,500, $3,000, and $2,800 confirmed structural weakness, with price continuing to form lower highs and lower lows.
A recent capitulation move pushed ETH toward $1,850, where buyers stepped in, triggering a short-term stabilization phase. However, this consolidation still appears corrective rather than a confirmed reversal.
The $1,850–$1,900 zone now serves as critical support, with a breakdown exposing $1,750 and potentially $1,500–$1,600. Immediate resistance sits between $1,980 and $2,020, aligned with the 20-day SMA and middle Bollinger Band.
A move above $2,120 would mark the first meaningful bullish shift, while broader recovery would require reclaiming $2,400–$2,500. A break toward $2,800 would be needed to invalidate the prevailing bearish structure.
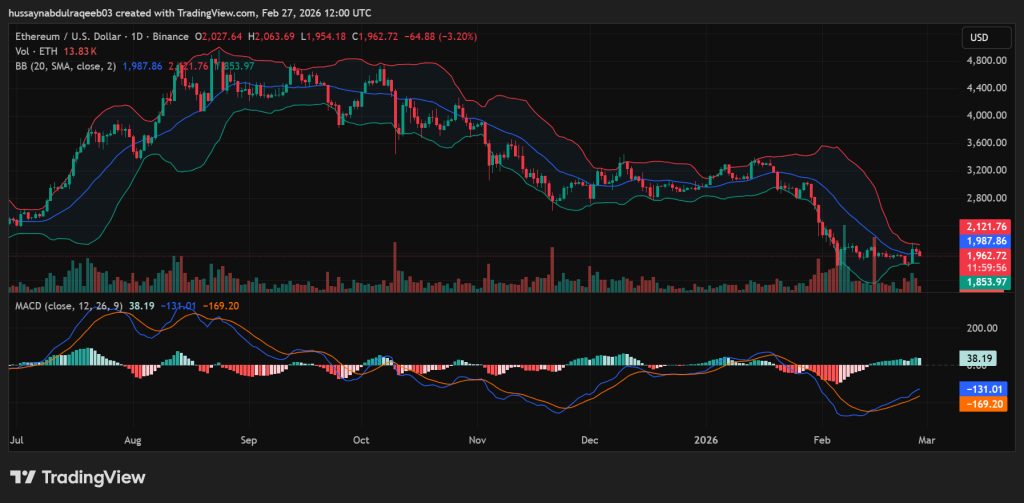
Fibonacci retracement levels from $4,800 to $1,850 place the 0.236 level at $2,550 and the 0.382 at $3,000. With ETH trading well below these thresholds, recent rallies remain technically corrective. The inability to reclaim even shallow retracement levels reinforces that bulls have not regained control of the broader trend.
Momentum indicators show early signs of stabilization but no confirmed reversal. Bollinger Bands remain wide, reflecting elevated volatility, while price struggles below the mid-band near $2,000.
The MACD is attempting a bullish crossover but remains below the zero line, and RSI has likely rebounded from oversold levels into the mid-40s, signaling neutral-to-bearish momentum. Volume spiked during the sell-off but has faded on the bounce, suggesting relief rather than strong accumulation.
Overall, Ethereum is consolidating at a key decision zone. A sustained move above $2,120 would improve the outlook, while a break below $1,850 would likely accelerate downside pressure. Until a decisive breakout occurs, the broader structure remains bearish.
Disclaimer: Coinwaft is a crypto media platform providing cryptocurrency news, analysis, and trading information. The content of this article is for informational purposes only and should not be considered as financial, legal, or investment advice. Readers are advised once again to research or consult a financial expert before making any financial decision.
© 2026 Coinwaft. All Rights Reserved.

Abdul-Raqeeb Hussayn
Abdul-Raqeeb Hussayn
I'm a Web3 content writer with a Web2 marketing background. I create blogs, reports, and market analysis that make complex blockchain concepts clear for readers and credible for investors.
Author profileTrending Today

Bitcoin
BTC
$65,251.32

PAX Gold
PAXG
$5,427.78

Grass
GRASS
$0.26

River
RIVER
$14.42

Venice Token
VVV
$6.16

Solana
SOL
$82.65

Tether Gold
XAUT
$5,349.49

Hyperliquid
HYPE
$31.67
newsletter
Busy Wealth
Join the Busy Wealth newsletter that helps thousands of investors get early alpha and understand the crypto market.
By pressing the "Subscribe button" you agree with our Privacy Policy.
Crypto Today