 Coinwaft
Solana Slides to $82 Despite Launch of New Payment Portal with Built-In Transaction Simulator
Network launches unified payment integration hub as token sheds 5.39% amid extreme market fear
21 hours ago
Last updated
21 hours ago

KEY FACTS
- Solana dropped 5.39% to $82.65 as the broader crypto market fell 3% amid extreme fear sentiment.
- The network launched Solana Payments, a new portal with transaction simulation tools targeting enterprise adoption.
- Solana ETFs recorded $51.52 million in weekly net inflows despite the price decline.
Solana has dropped to $82.65 amid broader market weakness, even as the blockchain network unveiled Solana Payments, a new hub designed to streamline cryptocurrency payment integration for developers and enterprises.
The token recorded a 5.39% decline over the past 24 hours and a 0.41% weekly loss. Its market capitalization fell to approximately $46.98 billion, shedding 5.33% in a single day.
Meanwhile, institutional interest remained positive. According to Lookonchain, Solana ETFs registered a one-day net inflow of 325,262 SOL, worth $28.3 million. The seven-day net inflow reached 592,226 SOL, totaling $51.52 million.
The broader cryptocurrency market cap declined 3.01% to $2.28 trillion. Market sentiment remained in “Extreme Fear” territory with a reading of 16 on the fear and greed index.
Solana Payments Targets Enterprise Adoption
The newly launched Solana Payments portal serves as a unified informational platform for integrating cryptocurrency payments. It compiles technical documentation, network statistics, and real-time transaction simulation tools.
Developers have also included examples of successful ecosystem projects. The portal aims to showcase the blockchain’s advantages for financial integrations.
Major financial institutions already utilize Solana’s infrastructure. Visa, PayPal, Stripe, and Western Union have incorporated the network into their products. Primary use cases include cross-border transfers, instant payroll, vendor payments, and corporate treasury management.
The project team released historical performance data alongside the launch. Over six years, the network has processed more than 480 billion transactions. Quarterly stablecoin settlement volume reaches $2 trillion, while transfers in other digital assets exceed $300 million monthly.
In artificial intelligence applications, Solana holds 49% of the micropayments market between AI agents based on the x402 protocol.
Solana Network Outperforms Base on Key Metrics
Solana significantly outpaces Base in scalability benchmarks. Current throughput stands at 1,140 transactions per second, nearly ten times Base’s 118.5 TPS. Solana’s historical peak reached 5,289 TPS compared to 1,988 TPS for the competing network.
The blockchain’s theoretical limit is 65,000 transactions per second. Base’s maximum capacity is 3,571 TPS.
Speed metrics favor Solana for retail payment applications. Block creation time is 0.39 seconds versus 2 seconds for Base. Full transaction finalization on Solana takes 12.8 seconds, while Base requires over 13 minutes.
Transaction costs also differ substantially. Solana’s average fee is approximately $0.0058, roughly 62% lower than Base’s $0.015 average.
Back in February, the Solana team unveiled a roadmap for creating high-speed infrastructure in the Asia-Pacific region.
Technical Analysis
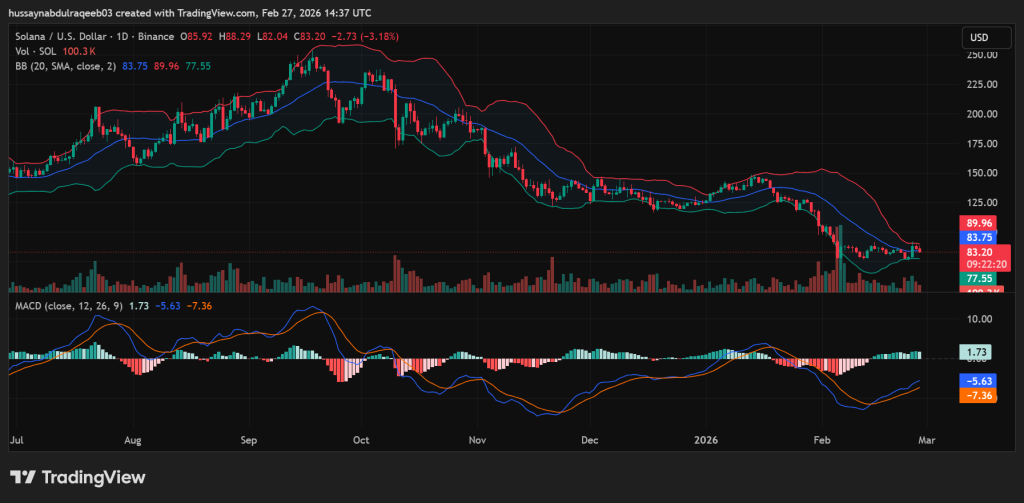
Solana trades at $83.20 on the daily chart, down 3.18%. The dominant trend remains bearish, with sequential lower highs from $250 to $145 and lower lows from $200 to $77 since September 2025.
Bollinger Bands show the upper band at $89.96, the middle band at $83.75, and the lower band at $77.55. Price recently bounced from the lower band support and now tests the middle band as resistance.
The MACD reading shows the MACD line at 1.73 and the signal line at -5.63. A bullish divergence is forming as price made new lows while the histogram printed higher lows. Both lines remain in negative territory.
Volume spiked during the February decline to $77, marking a classic selling climax pattern. Subsequent bounce volume has been significantly reduced, suggesting weak buyer conviction.
Immediate resistance zones sit at $83-85, $89-90, and $100-105. Critical support levels include $77-78, $72-75, and $65-68.
Fibonacci retracement analysis from the $250 high to $77 low places the 0.236 level at $115. Current trading well below this level confirms strong bearish control.
A potential falling wedge pattern is forming with converging trendlines. Confirmation requires a breakout above $90. A double bottom attempt at $77-78 needs a neckline break above $90-95 for validation.
The price trajectory remains bearish in the short term. Defense of the $80 level on a daily closing basis is critical. A breakdown below this zone could trigger a test of $75 support.
Disclaimer: Coinwaft is a crypto media platform providing cryptocurrency news, analysis, and trading information. The content of this article is for informational purposes only and should not be considered as financial, legal, or investment advice. Readers are advised once again to research or consult a financial expert before making any financial decision.
© 2026 Coinwaft. All Rights Reserved.

Abdul-Raqeeb Hussayn
Abdul-Raqeeb Hussayn
I'm a Web3 content writer with a Web2 marketing background. I create blogs, reports, and market analysis that make complex blockchain concepts clear for readers and credible for investors.
Author profileTrending Today

Bitcoin
BTC
$65,893.97

PAX Gold
PAXG
$5,429.67

Venice Token
VVV
$6.18

Solana
SOL
$83.21

Hyperliquid
HYPE
$31.85

River
RIVER
$14.57

WAR
WAR
$0.02

Grass
GRASS
$0.26
newsletter
Busy Wealth
Join the Busy Wealth newsletter that helps thousands of investors get early alpha and understand the crypto market.
By pressing the "Subscribe button" you agree with our Privacy Policy.
Crypto Today