 Coinwaft
Solana Stabilizes Around the $80 Level Amid Bullish On-Chain Surge
Record 148 million daily transactions contrast with depressed prices as technical indicators signal continued bearish pressure
8 hours ago
Last updated
8 hours ago

KEY FACTS
- Solana stabilizes near $80 despite 17% weekly decline as on-chain transactions hit all-time highs at 148 million daily
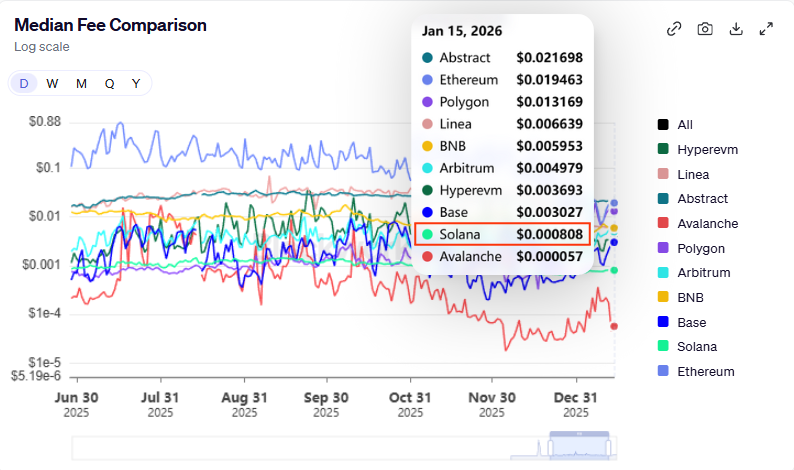
- Network leads in weekly dApp revenue over $30 million with fees three times lower than competitors
- Technical indicators remain bearish with RSI at 28 and MACD showing accelerating downward momentum
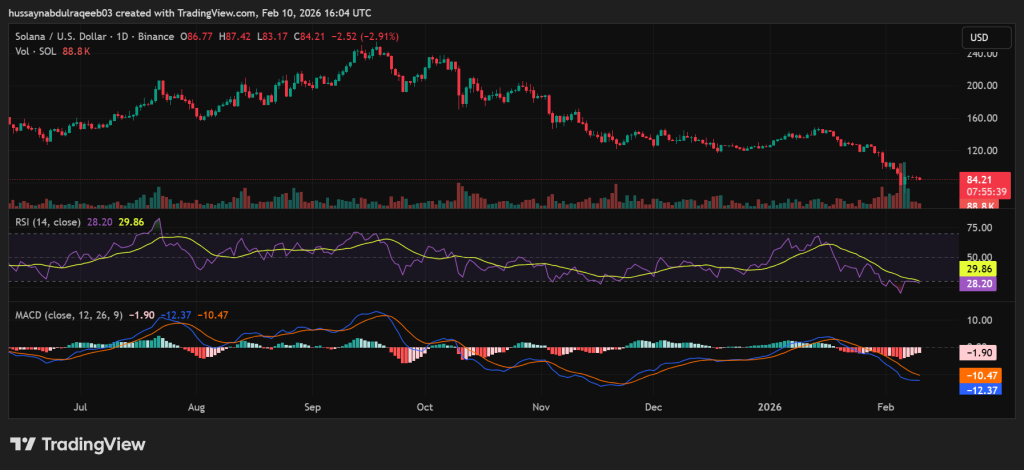
Solana has found footing near the $80 psychological support level despite enduring a punishing 17.46% weekly decline. The token currently trades at $84.17, posting a modest 1.13% drawdown over the past 24 hours. Market capitalization now stands at $47.79 billion as trading volume dipped 0.18%.
The stabilization arrives amid a striking divergence between price performance and network activity. Non-voting transactions recently reached 148 million in a single day, marking all-time highs for the blockchain. This surge in usage contrasts sharply with the depressed market valuation.
According to Lookonchain, exchange-traded funds tracking Solana recorded a net daily outflow of 142,052 SOL, equivalent to $12.07 million. Weekly ETF outflows totaled 208,067 SOL, valued at $17.69 million. Despite these withdrawals, cumulative ETF inflows remain robust at approximately $800 million.
The broader cryptocurrency market remains gripped by fear, with the Fear & Greed Index sitting at an extreme low of 10. Bitcoin dominance has climbed to 58.7%, signaling defensive capital rotation away from altcoins. The Altcoin Season Index reads 26, firmly indicating “Bitcoin Season.”
Solana On-Chain Metrics Show Strength Amid Downturn
Solana’s on-chain metrics paint a picture of remarkable strength beneath the surface price weakness. The network now leads all blockchains in weekly decentralized application revenue, generating over $30 million. DEX volume remains massive across the ecosystem.
Transaction fees on Solana rank among the lowest in the industry. Compared to major competitors including Ethereum, Base, and Arbitrum, Solana offers the second-lowest median fees. Costs run more than three times lower than those on Base.
These cost advantages position Solana as an attractive platform for developers and users alike. The combination of high throughput and minimal fees continues driving adoption even during the market downturn.
Bitcoin’s slide below $66,000 triggered a cascading 38% drop in SOL over the past 30 days. Traders now view dips below $90 as rare accumulation opportunities. Bullish projections target $300 by May, while bearish scenarios envision drops to $42 if support breaks.
SOL Faces Bearish Pressure as Corporate Losses Mount
U.S. corporate holders of Solana now face over $1.5 billion in unrealized losses. Social sentiment remains mixed, with bearish narratives surrounding memecoin-related losses amplifying negative ecosystem chatter. These factors compound the technical weakness.
The broader market structure shows SOL acting as a higher-beta asset in this risk-off environment. Capital continues rotating defensively toward Bitcoin, leaving altcoins vulnerable. A sustained drop in Bitcoin dominance could signal capital returning to alternatives.
The 78.6% Fibonacci retracement level sits at $84.12, now serving as immediate resistance. A daily close above $85.70 would suggest bearish pressure is easing. Failure to hold $82.94 risks testing the $80 psychological floor.
SOL Chart Reveals Dominant Bearish Trend Since September Peak
The daily chart reveals a dominant bearish trend since the September 2025 peak near $210. Price action shows a clear series of lower highs and lower lows. Recent trading broke below a consolidation zone with conviction.
The 14-period RSI sits at 28.20, deep in oversold territory. This reading typically precedes bounces, though strong downtrends can maintain oversold conditions for weeks. No bullish divergence has formed yet.
MACD indicators flash bearish across all components. The MACD line reads -10.47 against a signal line at -12.37. The histogram continues expanding downward, indicating accelerating negative momentum.
Key support levels stack at $80-82 for immediate defense, $75-78 as strong historical demand, and $70-72 as major extension targets. Resistance clusters at $95-100, $120-125, and $145-150.
Volume analysis shows elevated red bars during the recent selloff, suggesting institutional distribution. Bounce attempts feature lower green volume, indicating weak buying conviction. No capitulation spike has appeared yet.
A completed descending triangle pattern points toward targets in the $75-80 zone. A recent bear flag formation suggests continuation potential. The path of least resistance remains downward until broader sentiment improves. Bearish pressure dominates the near-term outlook.
Disclaimer: Coinwaft is a crypto media platform providing cryptocurrency news, analysis, and trading information. The content of this article is for informational purposes only and should not be considered as financial, legal, or investment advice. Readers are advised once again to research or consult a financial expert before making any financial decision.
© 2026 Coinwaft. All Rights Reserved.

Abdul-Raqeeb Hussayn
Abdul-Raqeeb Hussayn
I'm a Web3 content writer with a Web2 marketing background. I create blogs, reports, and market analysis that make complex blockchain concepts clear for readers and credible for investors.
Author profileTrending Today

Berachain
BERA
$1.23

LayerZero
ZRO
$2.29
Uniswap
UNI
$3.49

Pudgy Penguins
PENGU
$0.01

Hyperliquid
HYPE
$29.84

Bittensor
TAO
$148.53

Bitcoin
BTC
$67,597.56

Aave
AAVE
$108.89
newsletter
Busy Wealth
Join the Busy Wealth newsletter that helps thousands of investors get early alpha and understand the crypto market.
By pressing the "Subscribe button" you agree with our Privacy Policy.
Crypto Today